1997 - 2000 activity report
Observational cosmology
Evolution of galaxies: the contribution of ISOCAM
Observations with IRAS had shown the importance of the infrared spectrum in understanding the evolution of galaxies. The discovery of ultraluminous galaxies in the infrared spectrum had shown that some galaxies went through intense periods of star formation related to phenomena of collision and fusion between galaxies. In the near universe, there are very few of these ultraluminous galaxies; they represent only 2% of nearby galaxies in term of bolometric luminosity. What was the situation in the more distant universe? IRAS was not sensitive enough to deal with this problem. Observations with the CFHT, the HST and Keck had shown considerable evolution of galaxies between existing galaxies and galaxies with a high redshift (z ? 2). This evolution was especially visible through the appearance, at redshift ? 0.8, of a population of dwarf galaxies whose blue colours indicating their young age. But the exact significance of this phenomenon in terms of the global activity of galaxies remained subject to caution because these observations were based on measurements at UV wavelengths in the galaxy rest frame. As the level of absorption is very high in the UV band, determining the bolometric luminosity of galaxies on the basis of UV luminosities is very unreliable. ISO, with ISOCAM and ISOPHOT, gave a better understanding of the evolution of galaxies with high z. (fig.1)
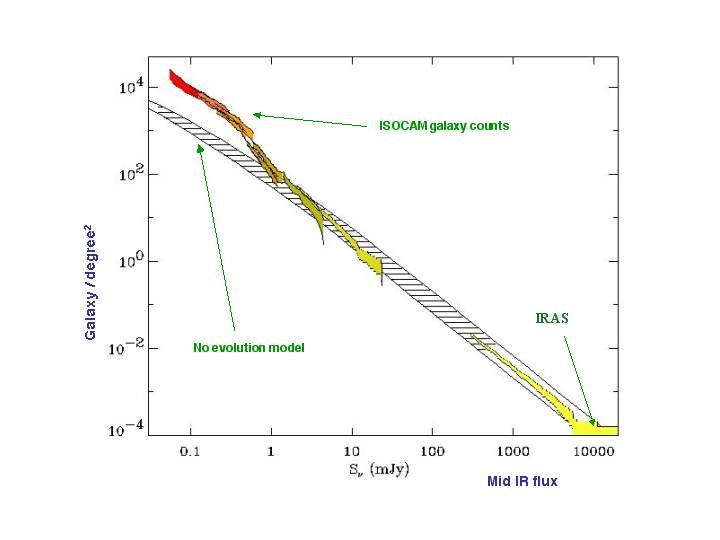
A set of deep surveys organized according to the Russian doll principle was conducted for the ISOCAM guaranteed time by SAp in association with researchers in the ISOCAM consortium. These surveys revealed a considerable evolution in galaxy counts in the case of galaxies with a luminosity of less than 1 mJy, i.e. one hundred times fainter than the faintest galaxies discovered by IRAS (Elbaz et al., 1998, 1999). Analysis of the observations made in Hubble Deep Field North (HDFN) explained the reason for this excess. On the contrary to what is observed in the visible band, where evolution is due to the appearance of a class of very blue, dwarf galaxies, the excess of infrared galaxies is due to an excess infrared emission from some normal galaxies (Aussel et al, 1999). The location of ISOCAM sources is sufficiently precise to allow the unambiguous identification of most ISOCAM sources with galaxies in HDFN (fig. 2). The mean redshift of the galaxies detected by ISOCAM is 0.8. These galaxies have infrared luminosities larger than 1011 L§ They have star formation rate of the order of 100 M§/yr-1 hundred time larger than the one of a local spiral galaxy. About half of them present complex morphologies which seem to indicate that they are interacting while the remaining ones belong to overdense regions relative to the field and may therefore be subject to tidal interactions (Aussel et al. 2001).
|
|
|
Figure 1. Integral galaxy counts for galaxies observed at 15 mm by ISOCAM 'Elbaz et al, 1999). A model without galaxy evolution is fitted to the IRAS 12 mm galaxy counts. A strong departure of the galaxy counts from the no-evolution model is observed for luminosity below 1 mJy. |
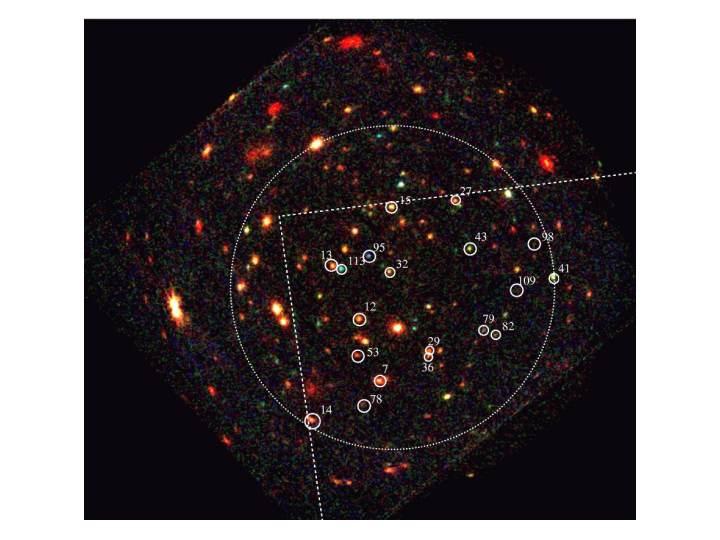
Figure 2 : XMM image of the Lockman Hole (Hasinger et al, 2001). This is the deepest image obtained with XMM during the Performance Verification phase. The faintest sources detected have an X ray flux of 0.31 10-15 erg/cm2 /s and 2.4 10-15 erg/cm2 /s in the 0.5 - 2 and 5 - 10 kev band.. Sources identified with circles are those common between XMM and ISOCAM 15 mm map. Dashed lines indicate the field cover by ISOCAM observations. Only 15% of the ISOCAM sources have X-rays counterpart. This demonstrates that most of the sources detected in the ISOCAM deep surveys are indeed starburst galaxies and not dust enshrouded AGN (Fadda et al, 2001). |
What is the main origin of their strong luminosities: an active nucleus or a starburst ? Two complementary tests indicate that they are more probably mostly powered by star formation. The first test is the cross-correlation of the sources lists of ISOCAM and XMM/EPIC in a common field, the Lockman Hole (fig. 3). Less than 15 % of the ISOCAM galaxies present an X-ray counterpart detected with XMM (Fadda et al., 2001). Furthermore, those X-ray counterparts are among the faintest XMM sources and only a fraction of them are compatible with being powered by an AGN. Hence the bulk of ISOCAM sources do not appear to be powered by dust extinct AGNs, unless they are Compton thick and exhibit extreme spectral properties to have been missed by XMM/EPIC at these low redshifts. This result is confirmed by the same type of comparison in the HDFN with the deepest CHANDRA survey available at present. In the same HDFN, several ISOCAM sources were detected in the radio continuum and present a very good correlation between their 15 micrometer and radio fluxes, as expected for star forming galaxies (Aussel et al. 2001). Both test strongly favour the starburst hypothesis.
The results of ISOCAM deep surveys are thus compatible with the existence of an intense star formation episode between z= 0.4 and 1.3. Based on the correlations found in local galaxies between the mid (6.75, 12 & 15 micrometers) and far infrared luminosities (hence also with the star formation rate of these galaxies), we found that the comoving density of star formation was about 25 times greater at z~0.8 than it is today (Chary & Elbaz 2001, ApJ 556, 562). We can also compare these results with the diffuse extragalactic background determined on the basis of COBE observations above about 100 micrometers, by estimating the contribution of ISOCAM galaxies these wavelengths. If the galaxies detected at 15 micrometers by ISOCAM shared the same spectral energy distribution than the ultraluminous infrared galaxy Arp 220, then they would produce an extragalactic background ten times greater than measured at 140 micrometers. Using more typical spectral energy distributions, like the ones of the galaxies M 82 or the Antennae, or using the correlations existing between the mid and far infrared luminosities, it can be demonstrated that these galaxies are responsible for the bulk of the diffuse extragalactic background light at 140 micrometers.
Galaxies that are luminous in the infrared spectrum are not distributed by mere chance. In HDFN, they are more correlated than galaxies as a whole, which suggests that they are concentrated in the densest parts of large scale structures (Aussel et al., 2001). In galaxy clusters, ISOCAM deep surveys were able to detect the mid infrared emission of some cluster members due to embedded star formation which was previously missed by optical surveys (Fadda et al., 2000, Duc et al. 2000). These observations not only confirmed the presence of a larger number of star forming galaxies with increasing redshift as already indicated by their blue luminosity (the so-called Butcher-Oemler effect), but they also unveiled star formation in galaxies previously thought to be passively evolving. All these indications point in the same direction. Luminous galaxies in the infrared spectrum are located in high-density regions of galaxies and where there are gas rich galaxies, which can fuel intense starbursts in the event of interactions or fusion with other galaxies. These results back up the hypothesis of hierarchical fusion processes to explain the formation of galaxies.
Galaxy clusters and large scale structures
Galaxy clusters are the largest entities that have reached a state in the vicinity of equilibrium. Understanding their internal physics and their evolution is thus one of the keys to understanding the process of the formation of structures in the universe. This physics is complex, involving gravity but also interactions between galaxies, the ejection of gas by galaxies and the physics of intracluster gas. Apart from dark matter, the main constituent of clusters is intracluster gas, which represents 2 or 3 times more matter than that observed in galaxies themselves. This low-density and very hot gas emits in the X-ray band. X-ray observatories are therefore especially useful tools for the study of galaxy clusters. SAp researchers have been using the available satellites to conduct their research for many years. In recent years, they have used differents satellites, GINGA, ROSAT, ASCA and, above all, XMM to which SAp made a major contribution. This work has gone hand in hand with numerical simulations concerning the physics of intracluster plasma.
Relaxed clusters and mass distribution
Using x-ray surface brightness maps, we can determine the density profile of the intracluster gas. If the mean temperature of that gas is known, and we also assume that this gas is in hydrostatic equilibrium and isothermal, we can calculate the gravitational potential and, thus, the density profile of the dark matter in the cluster. This has been done for two rich clusters, A2218 (Squires et al., 1997) and A2163 (Squires et al., 1996). For both these clusters, the distribution of dark matter obtained is very similar to that derived from observations of the arcs created by gravitational lens effects. This agreement appears to validate the hypothesis of a gas in hydrostatic equilibrium. The same method can be applied to more distant clusters. The cluster 3C295 at a redshift of 0.46 was studied by D.Neumann (1999) using ROSAT observations. The X-ray map shows no evidence of sub-structures, suggesting that the cluster is in a relaxed state. The gas mass fraction is consistent with the value found for nearby clusters. These data confirm the presence of a cooling flow at the centre. This one of the two most distant cooling flow ever-detected in X-ray.
Precise spatially resolved spectroscopy became possible with XMM/EPIC, allowing taking into account possible temperature gradients in the mass estimate. The shape of the temperature profiles, as measured by previous instruments, like ASCA or Beppo-Sax, was a matter of debate. XMM has a much better sensitivity and spatial resolution, which is essential to decrease statistical and systematic errors. The capability of XMM-Newton to measure cluster temperature profiles was illustrated by Arnaud et al (2001), using the PV observation of A1795, a bright cluster at z=0.063. Beyond the cooling flow region, where a clear resolved drop in temperature is observed, the temperature profile is remarkably flat, up to 0.4 virial radius (Fig4).
Scaling laws and cosmological parameters
Galaxy clusters can be used to constrain cosmological parameters. One of the direct measures of the Hubble constant, H0, is via the Sunayev-Zeldovich (SZ) effect. This effect, independent on the cluster distance, is the Compton scattering of the cosmic cosmic background (CMB) radiation by the hot intracluster gas, giving rise to an observable distortion of CMB spectrum. The cluster distance, and thus H0 if the redshift is known, can be derived by combining X-ray and SZ data. However the value obtained is sensitive to the assumed ICM internal structure. The first estimate of H0 using spatially resolved X-ray and SZ data, was made by Holzapfel et al. (1997). Data from ROSAT, ASCA, Ginga and SUZY were combined to determine the ICM density structure and to constraint the temperature structure. A value of 60 +40 -23 km s-1 Mpc-1 was obtained.
|
|
|
Figure 3. Radial temperature profile of A1795 as a function of angular radius (upper axis) and scaled radius (lower ��axis), derived from XMM/EPIC data (Arnaud et al, 2001b). The scaled radius is the radius divided by the virial radius. The horizontal line corresponds to the mean value derived from fitting the overall spectrum of the region from 2' to 10' radius. A significant and spatially resolved drop in temperature towards the center is observed, which corresponds to the cooling flow region of the cluster. Beyond that region the temperature is remarkably constant, with no indication of fall-off at large radii up to 0.4 virial radius. |
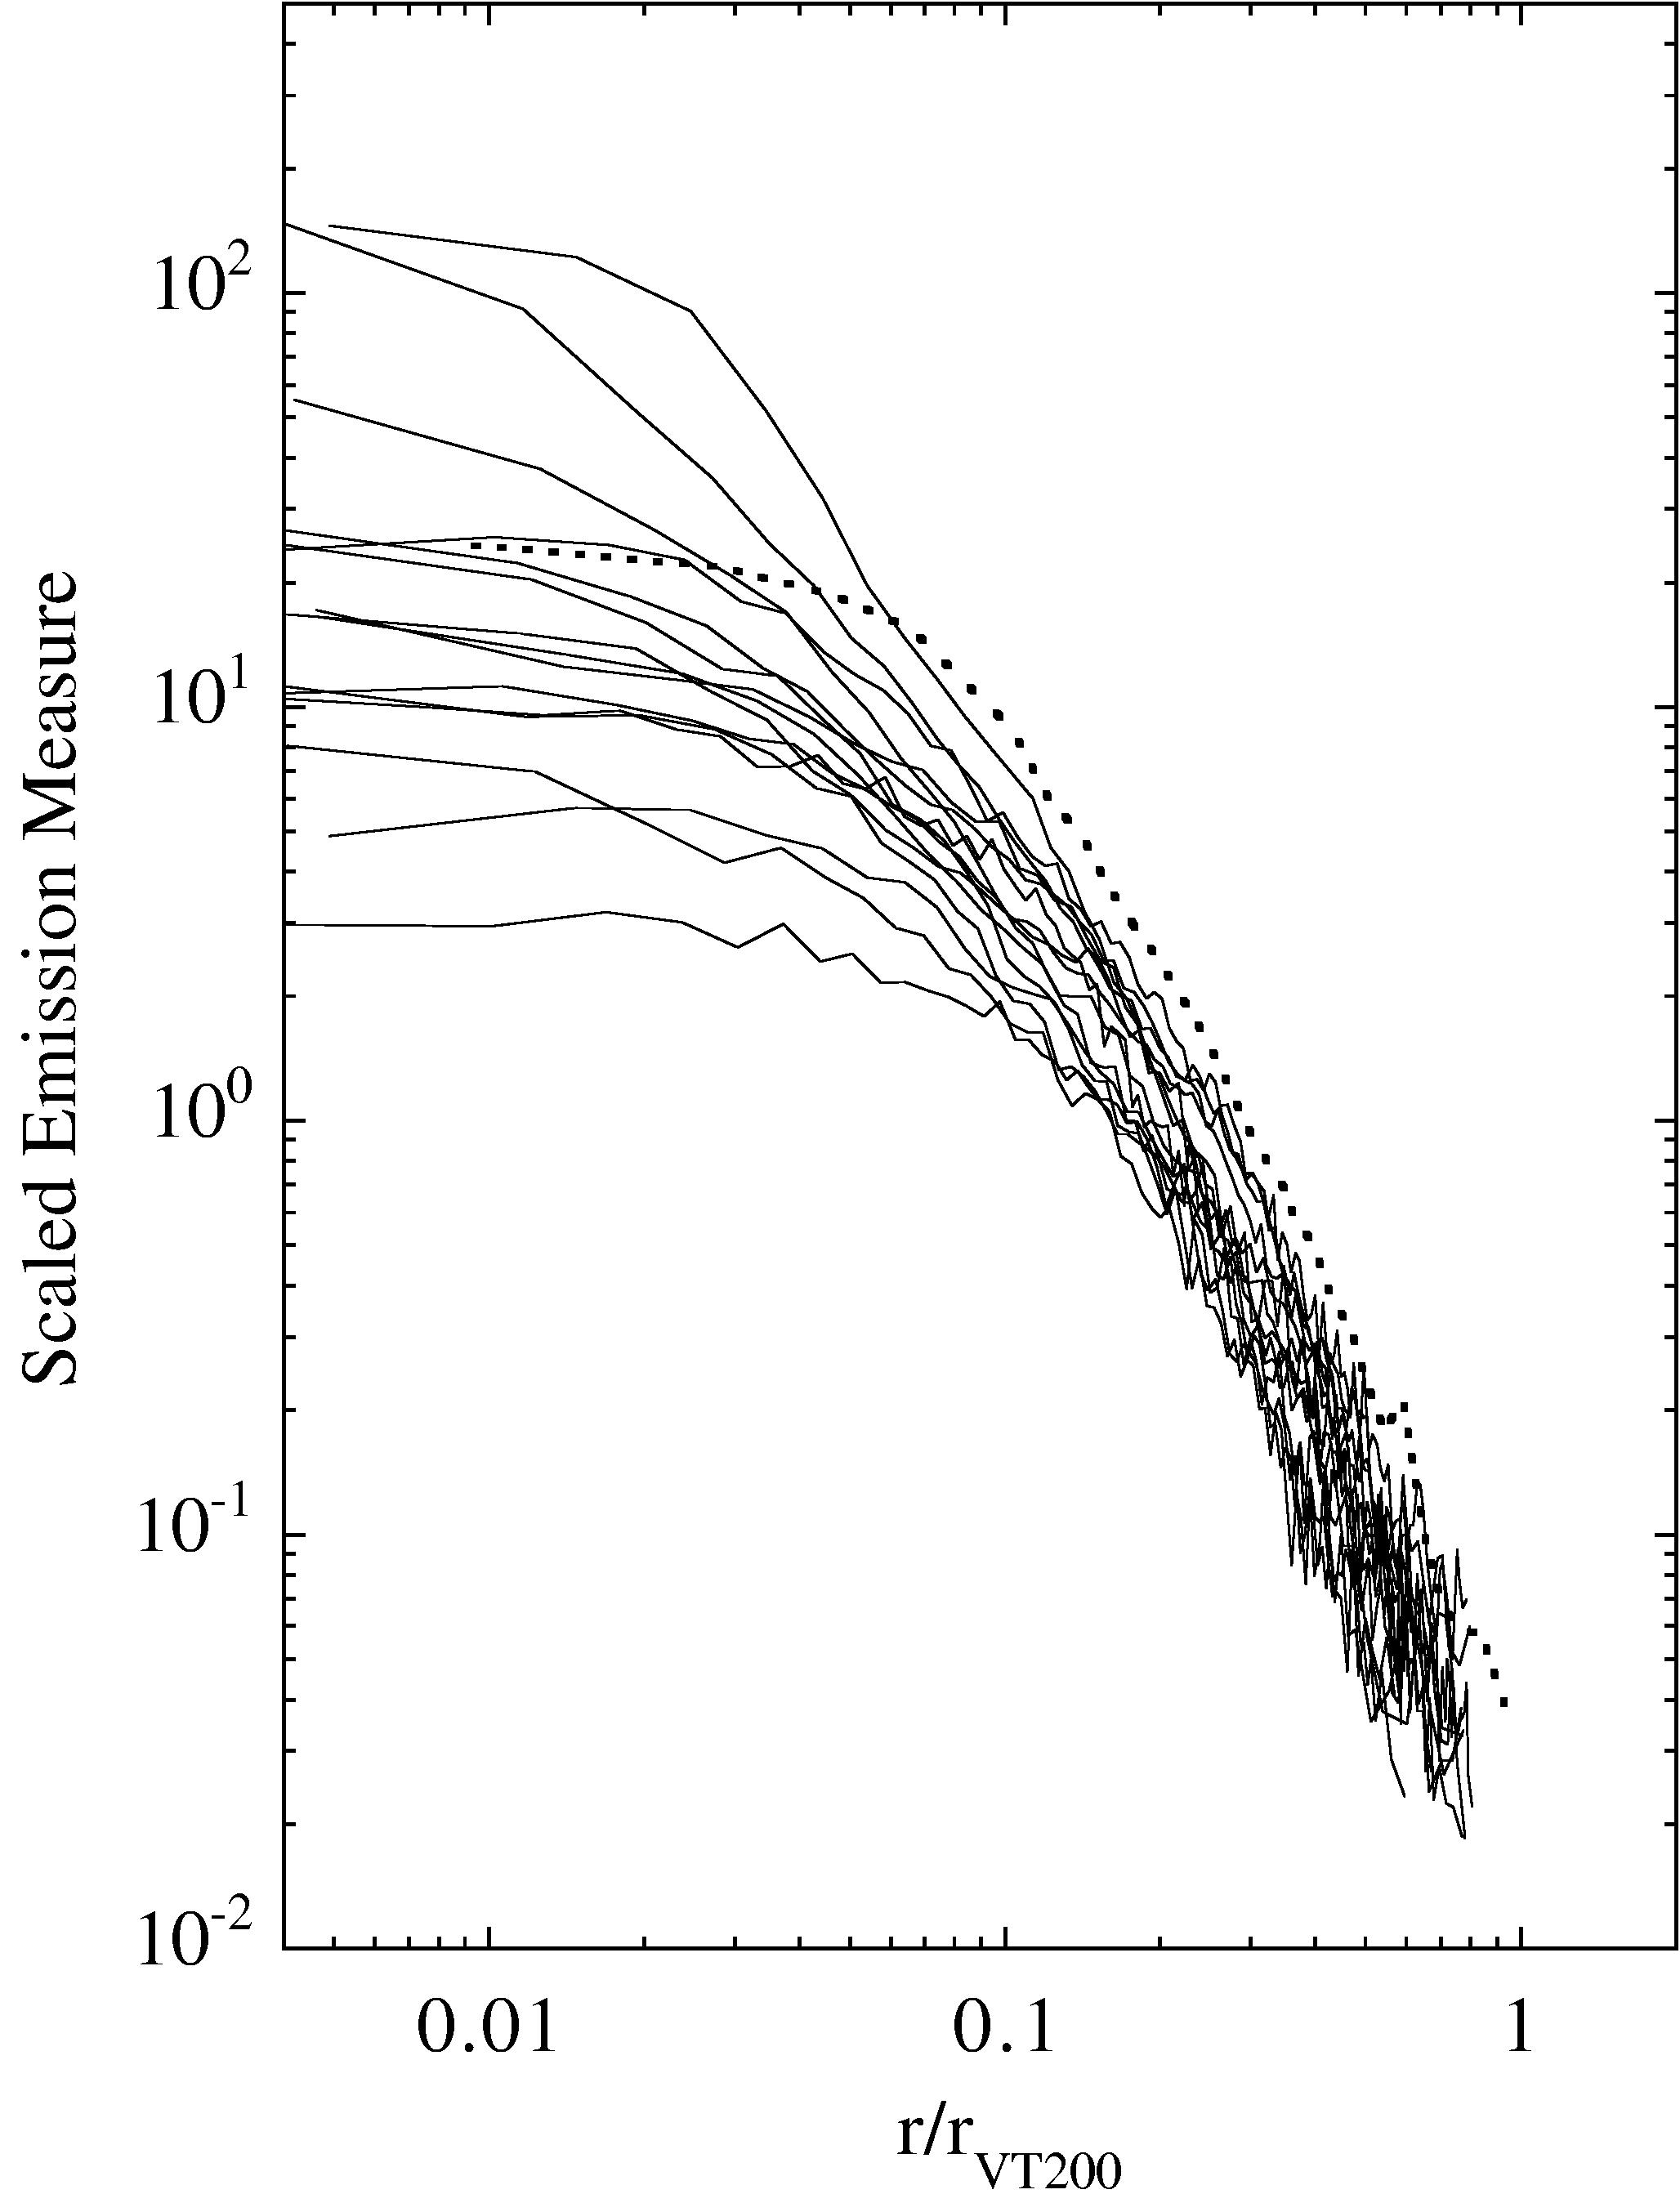
Figure 4 : Scaled emission measure profiles of a sample of hot clusters (temperature T >4keV) derived from ROSAT imaging data (Neumann & Arnaud, 1999). The radius is scaled by the virial radius, Rv. The emission measures have been scaled by T1/2, according to the standard self-similar model of cluster formation. Beyond about 0.1 virial radius the profiles look remarkably similar, as expected from the self-similar model. These data are well fitted beyond the core by a universal beta model for the gas density profile and support the existence of a universal underlying dark matter profile.. |
The baryonic mass fraction in cluster is thought to be representative of the baryonic mass fraction in the Universe. It thus set limits on the density parameter of the Universe, the Universe baryonic density being derived independently from the primordial nucleosynthesis. Arnaud et Evrard, (1999) examined the X-ray luminosity-temperature (Lx-T) relation using a homogeneous sample of 24 clusters. The clusters were selected for accurate temperature measurements and absence of strong cooling flow. The data exhibits a very tight power-law relation. This shows that there is only a slight dispersion of the gas mass fraction at a given cluster temperature (or mass). The fraction derived from these data, when combined with imaging data from the literature, is incompatible with a critical universe.
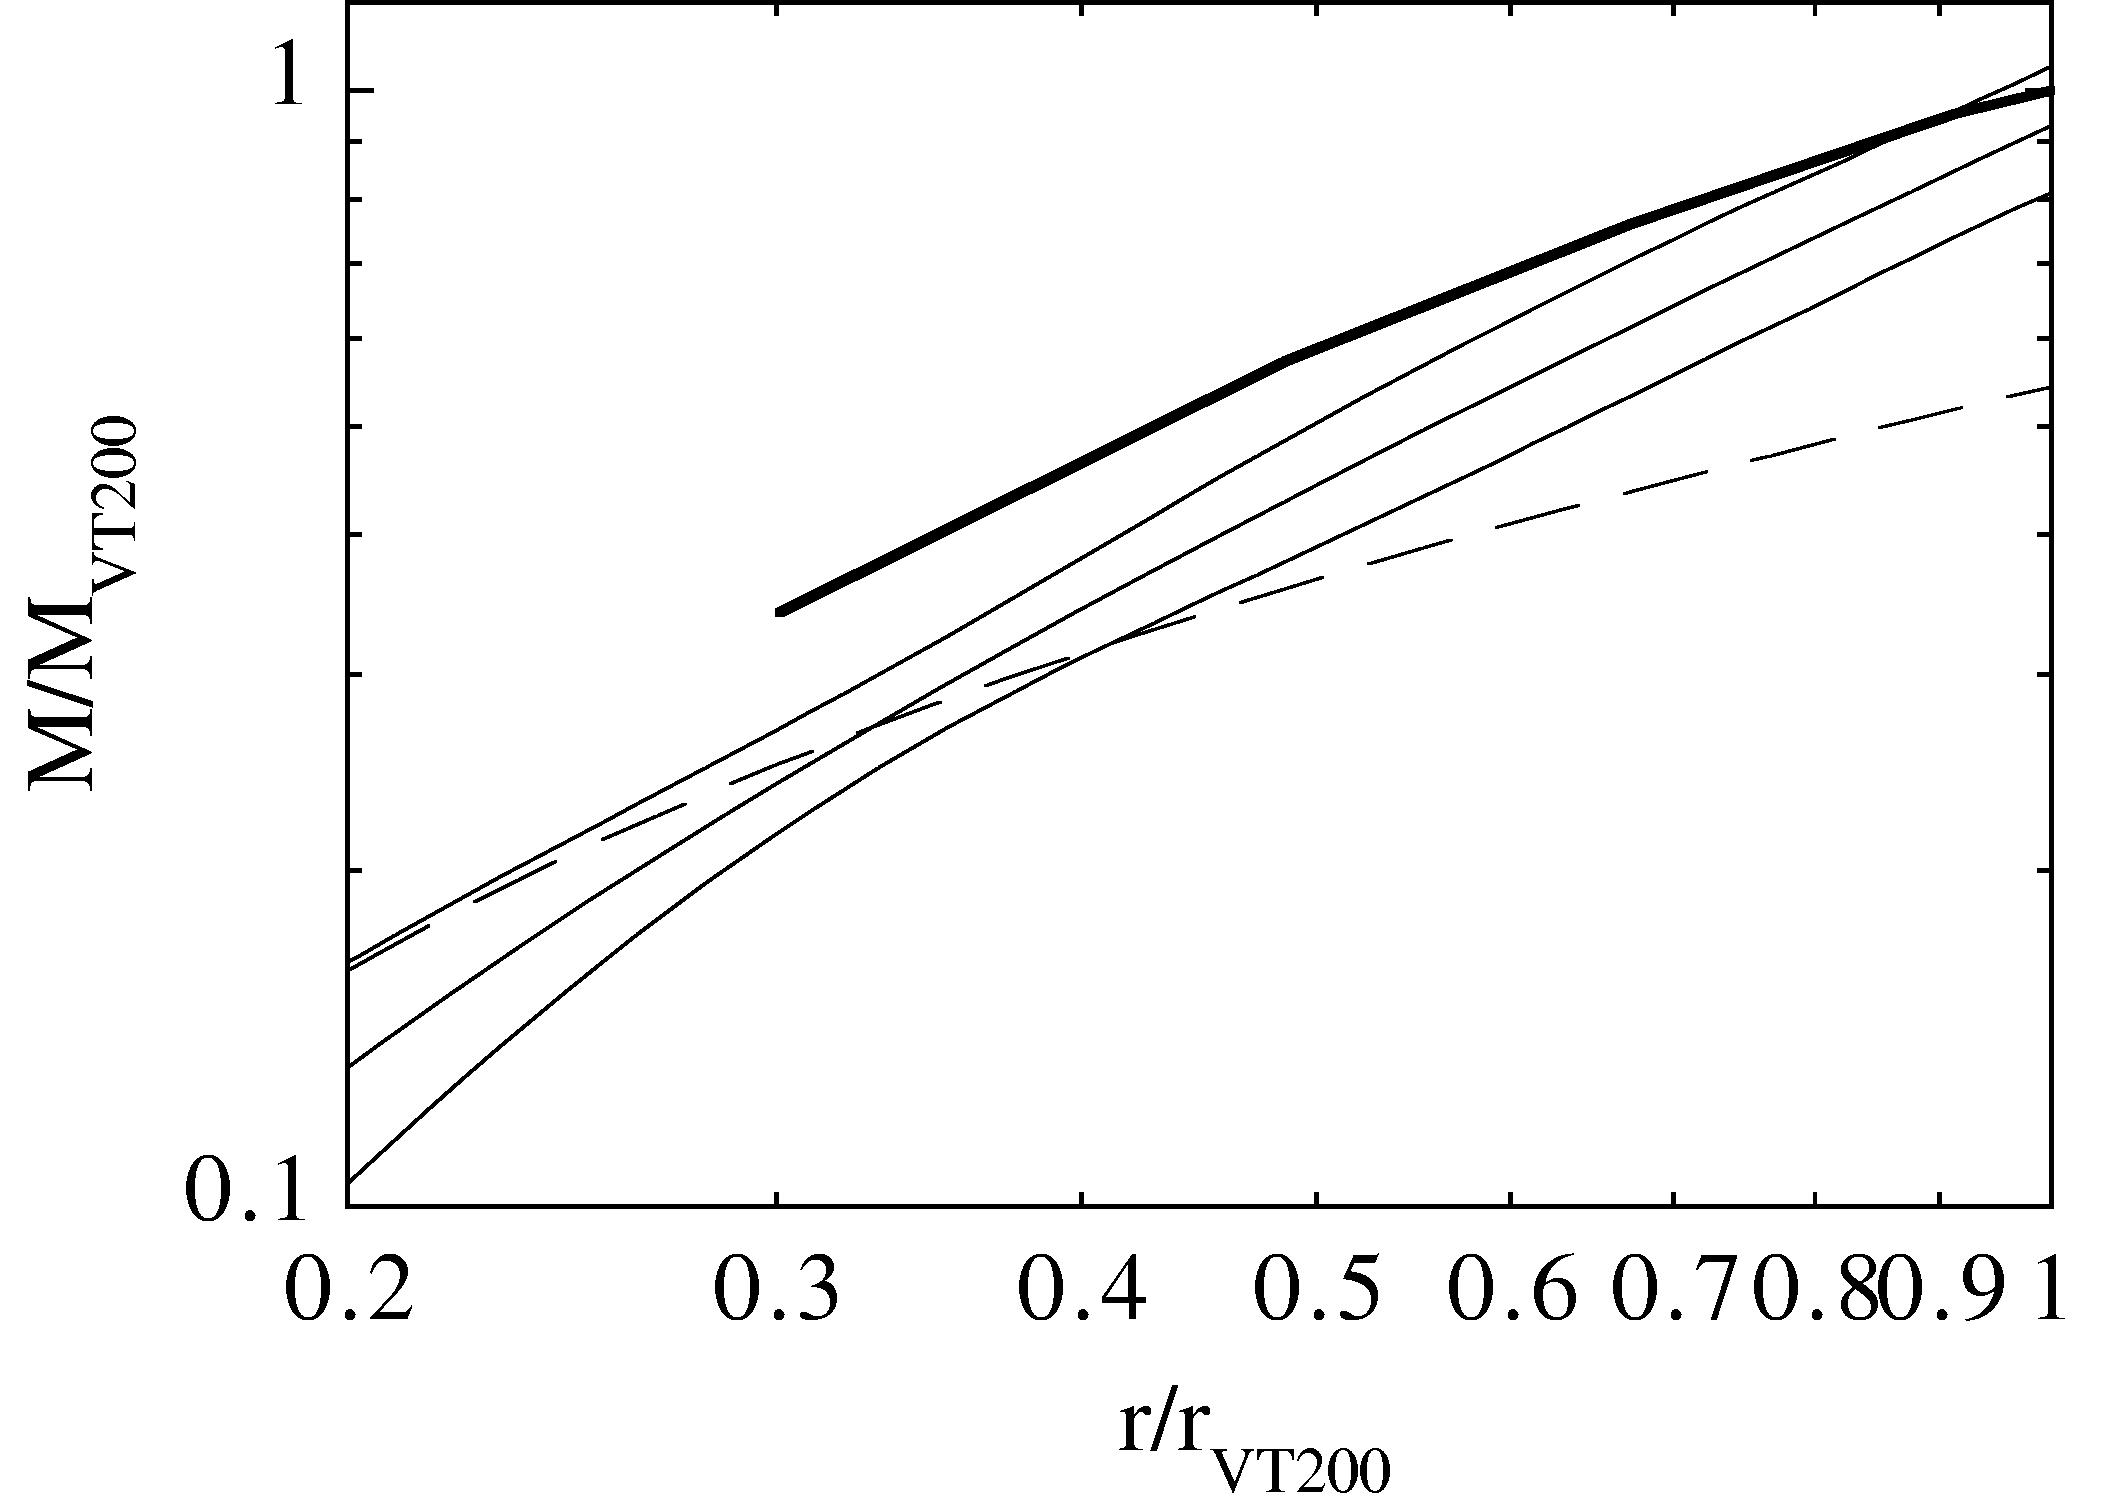
Such tight scaling laws are expected in the simple, purely gravitational, models of structure formation. Such models predict that clusters of galaxies form a homologous population: they are self-similar in shape and scaling laws relate each physical property to the cluster total mass and redshift. The observed slope of the Lx-T relation is higher than expected in such models. Arnaud & Evrard (1999) found evidence that both the shape and the gas mass fraction of clusters varies with the cluster temperature. This dependence explains the observed steepening of the Lx-T relation. Neumann et Arnaud (1999) showed that the former effect is however not important for the subsample of hot (T > 4 keV) clusters. Using archival ROSAT data, they examine the surface brightness profiles of massive X-ray clusters. The shapes of various clusters, once the radius is scaled to the virial radius, look remarkably similar outside the cooling flow region (Fig. 5). This supports the existence of a universal underlying dark matter profile and also suggests that non-gravitational effects, like pre-heating by galaxy winds, are negligible for this cluster population. The results are compatible with the classical scaling relation between mass and temperature. However, due to the uncertainty on the temperature profiles, no constrain can be put on the normalisation of this relation or on the intrinsic shape of the dark matter profile (Fig 6). As outlined above, the situation is changing rapidly with new XMM (and Chandra) observations.
|
Figure 5: Scaled total mass profiles estimated from the hydrostatic equation using the data shown on Figure 4 for the density profiles and assuming different temperature profiles (Neumann & Arnaud, 1999). The radius is scaled to the virial radius. The mass enclosed in a given radius is divided by the virial mass. Full lines: The middle line is the mean mass profile assuming an isothermal atmosphere. The top and bottom curves correspond to this mean plus or minus the bi-weight dispersion. Dotted line: Mean mass profile obtained for a polytropic temperature profile of index gamma= 1.2, approximating the results of Markevitch et al. (1999). The heavy line shows the expected profile from numerical simulations of Evrard, Metzler & Navarro (1996) for comparison. The uncertainties on the shape and normalisation of the mass profile are dominated by the uncertainty on the temperature profiles, as measured before XMM and Chandra.. |
Substructure and cluster mergers
In hierarchical structure formation models, such as the Cold Dark Matter model, clusters are formed from mergers of smaller units that have previously collapsed. Merger events are thus central to theories of cluster formation. The study of clusters in non-relaxed states, and of potential merger events, has been one of the major research fields in recent years. SAp researchers have contributed to this field using X-ray observations combined with optical data.
Neumann & Arnaud (2000) showed that one of the most distant clusters currently known, MS1054-03, with a redshift of z = 0.83, has a bimodal structure. A wavelet analysis of the ROSAT/HRI image revealed a main diffuse component and a compact substructure in the West. This is suggestive of an ongoing merger event (Fig 7). Notably, the cluster morphology was confirmed by a later CHANDRA observation, performed by an independent group. The observation of this cluster has further cosmological implications. The abundance of distant massive clusters, like MS1054-03, is used to constrain the density parameter of the Universe. However if the cluster is not in a relaxed state, the measured temperature could be a biased estimator of the virial temperature and thus the total mass overestimated by the virial theorem. This might be the case for MS1054-03, the gas mass fraction thus derived being significantly lower than the typical value of nearby clusters. Another way to resolve this discrepancy is to adopt a non-zero cosmological constant, which increases the value of the gas mass. A detailed analysis of the various alignment effects observed suggests that this cluster is currently forming at the crossing of two filaments. In structure formation models, the intersection of filaments are thought to be the natural place of rich cluster formation and A521 gives support to this scenario. More direct evidence was provided recently by the XMM mosaic observations of Coma. The Coma cluster belongs to a large-scale filamentary structure that defines the Coma-A1367 supercluster.
|
|
|
Figure 6. Colour ROSAT/HRI image of MS 1054-04 after applying a gaussian filter (Neumann & Arnaud 2000). The contours correspond to the restored image from a wavelet analysis of the raw image. The structure of the cluster is bimodal. The wavelet analysis further showed that the emission can be decomposed into a main diffuse component and a compact substructure centred on the second peak in the West. |
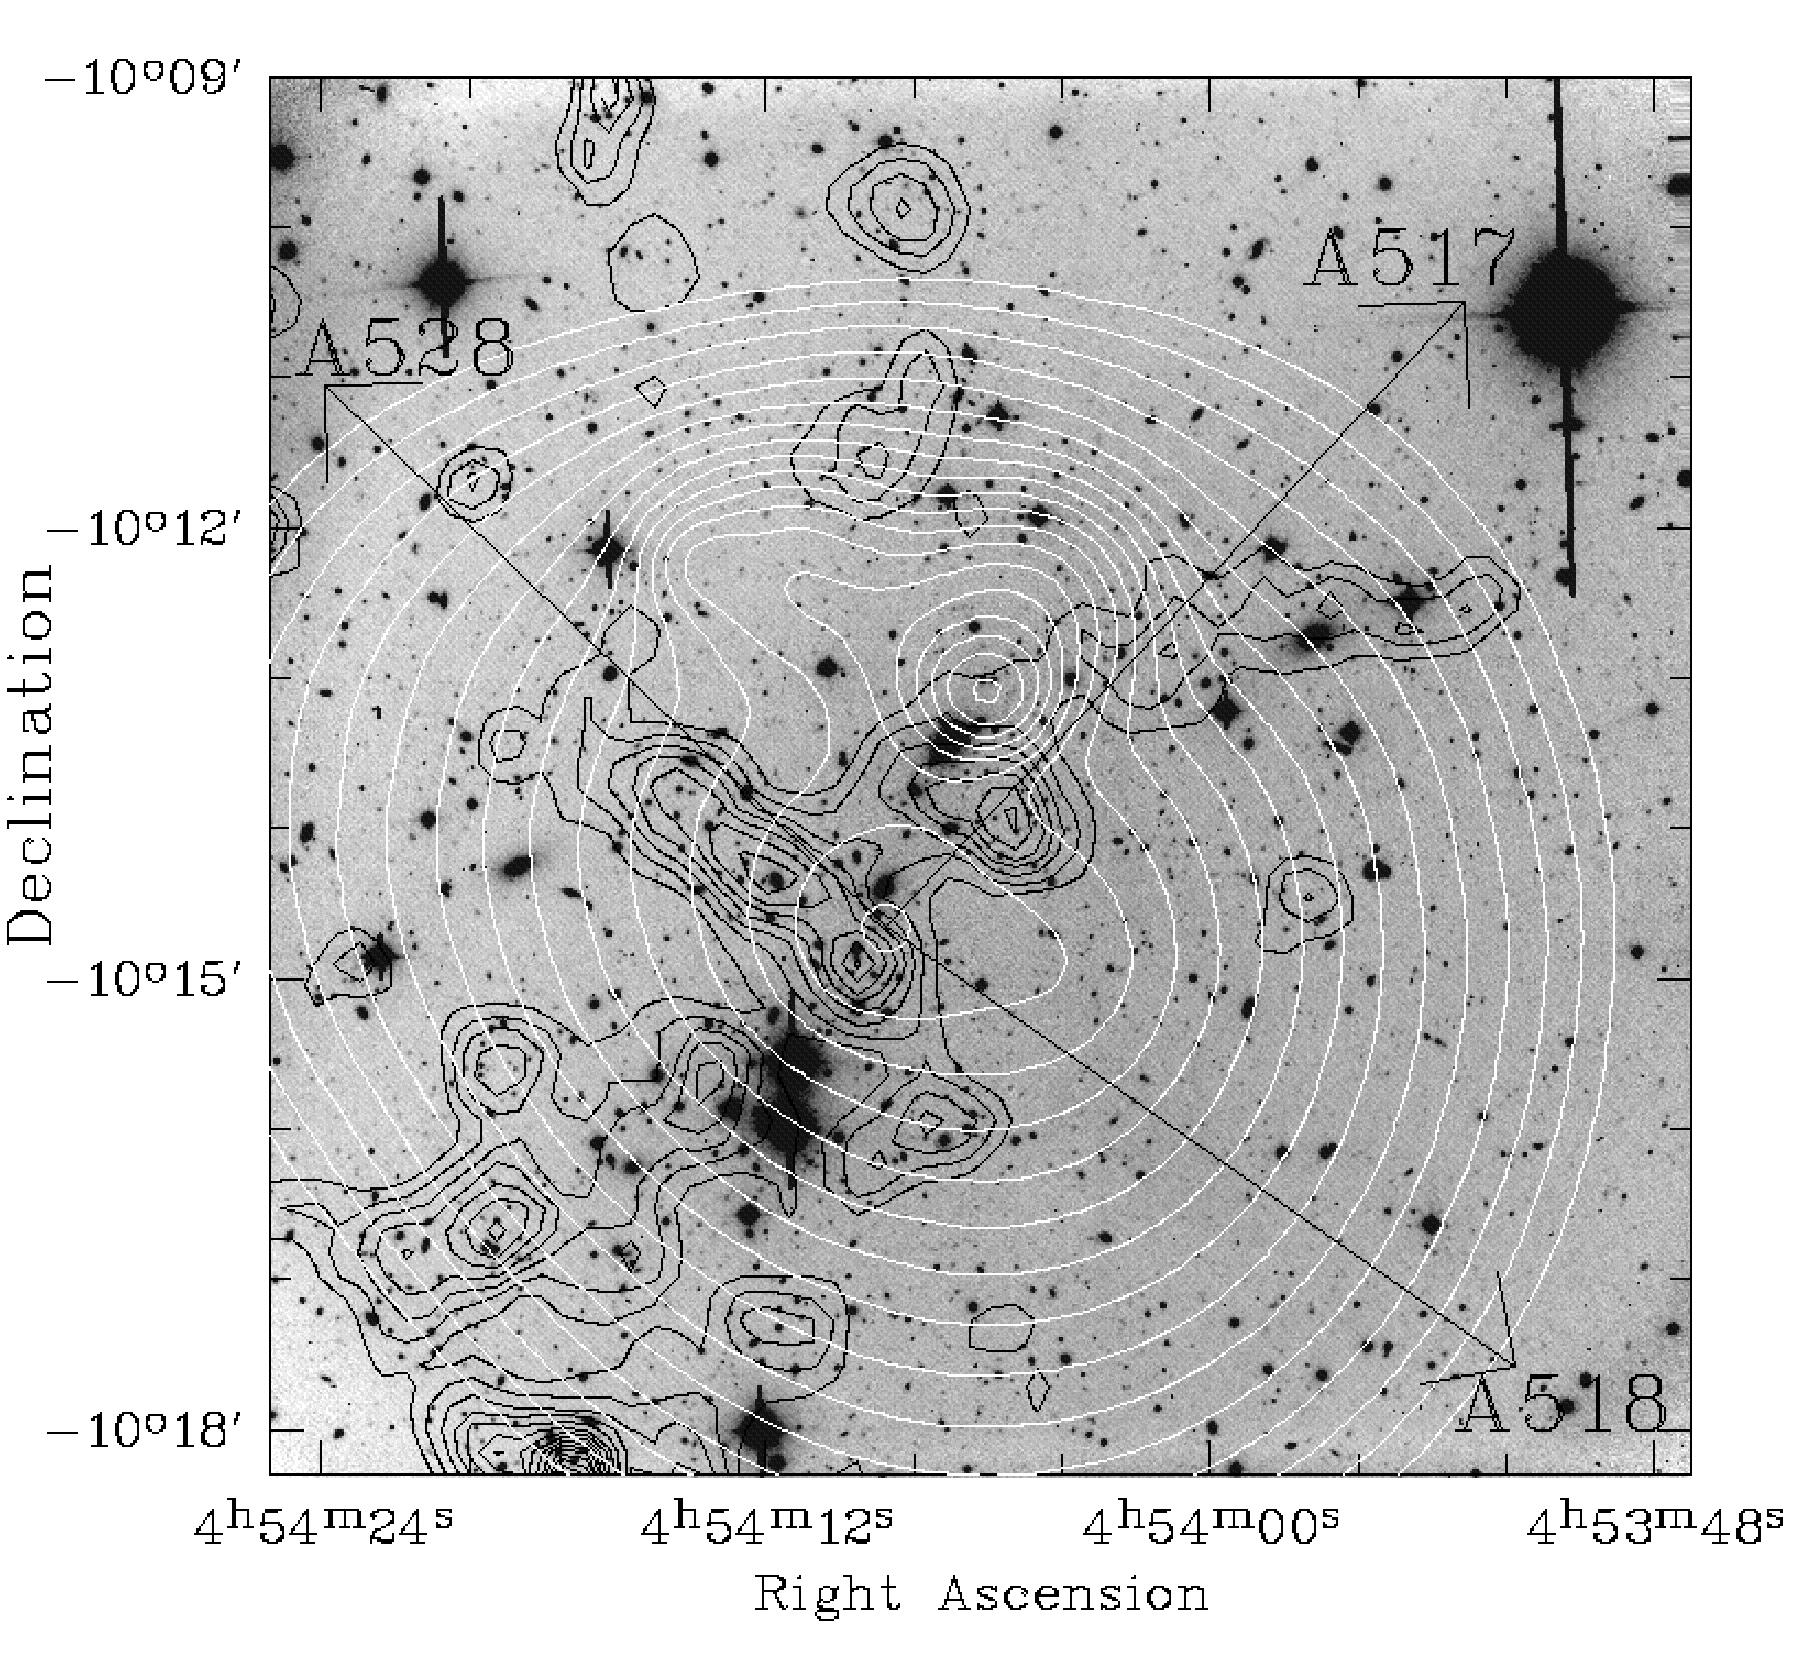
Figure 7 : Morphology of the galaxy cluster A521 (Arnaud et al, 2000). Galaxy iso-density contours (black lines) and X--ray iso-intensity (white lines) from ROSAT data are superimposed to the optical image in V-band obtained at CFHT. The direction towards the clusters A517, A528 and A518 are also indicated. The segregation between the gas and the galaxies subclustering is extremely severe. This is an indication of a very particular dynamical state. |
The analysis of the XMM Mosaic observation (Briel et al 2001; Arnaud et al 2001b; Neumann et al 2001) demonstrates that Coma is currently accreting subclusters along this preferred direction (see section I for more details).Merger events can also be observed in the near universe. By combining observations from ROSAT and ASCA with observations from CFH, Arnaud et al. (2000) and Maurogordato et al., (2000) showed that the cluster A521 is in a highly unrelaxed state, with a severe segregation between the galaxy and the gas substructures (Fig5)
Physics of intracluster gas
Intracluster gas is enriched with heavy elements produced in galaxies and ejected in the intracluster environment by hot winds driven by explosions of supernovas. ASCA was the first observatory to map the distribution of heavy elements in intracluster gas. Finoguenov et al., (2001) derived the Si and Fe abundance profiles, for a sample of 18 cool clusters. Ne and S abundance profiles were also derived for some clusters. The preferential accretion of low-entropy, low-abundance gas into the potentials of groups and cool clusters can explain most of the observed trends in metallicity. These data also proves the importance of early SNII feedback on the thermo-dynamical evolution of the gaseous component of clusters.
At the centres of clusters, the density of the gas increases considerably, and thus the radiative cooling. The cooling time can became less than the age of the cluster and a cooling flow is produced. One of the most unexpected results from XMM was the observation of the central region of A1835. Although there is a cooling flow at the centre, there seems to be no very cold gas. The temperature limit is 2.7 keV. The absence of a colder gas is incompatible with the classic models (Peterson et al., 2001).
Large Scale Structure
The simultaneous use of XMM and MEGACAM will allow considerable progress to be made in our understanding of large structures. X-ray observations will enable us to find rich galaxies, the measurement of cosmic shear by the gravitational lens effect with MEGACAM will make it possible to ascertain the distribution of dark matter, and the detection of galaxies with MEGACAM will allow us to pinpoint galaxies with respect to gravitational structures. A major effort has been made in the preparation of these coupled observations on the basis of digital simulations of filament type structures and x-ray clusters and on the developing of a method of detecting wide sources with low surface brightness by filtering using wavelets with Poisson statistics (Pierre et al., 2000).
|
|
| DSM/DAPNIA/Service d'Astrophysique | mise à jour : 15/10/2001 |
| Observational Cosmology | © CEA 2001 - Tous droits réservés |
