Florent Renaud - May 2013
log(Σ [M⊙pc-2])

0.0
0.0
0.0
About the simulation
A few details
Renaud et al. (2013) (presentation, large scale ISM)
Kraljic et al. (2014) (star formation relations)
Contact: florent.renaud<at>cea.fr
What is displayed?
Surface density of gas from a hydrodynamic simulation of a Milky Way like galaxy, at sub-parsec resolution. The map is made of 174 762 tiles, each being a 1024 pixels x 1024 pixels 8-bits png image. The "big pixels" come from the AMR (adaptive mesh refinement) technique used in the simulation.
What happens at zoom levels 5 and 8?
The color table changes automatically, so that the contrast of the very dense structures is enhanced. You can also change the contrast manually by selecting the map type (in top-right corner).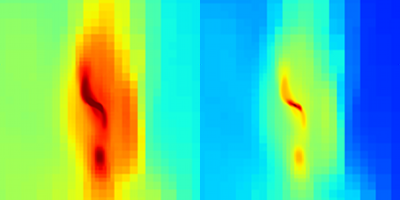 The same clump, seen with two contrasts.
(Can you find it on the map?)
The same clump, seen with two contrasts.
(Can you find it on the map?)