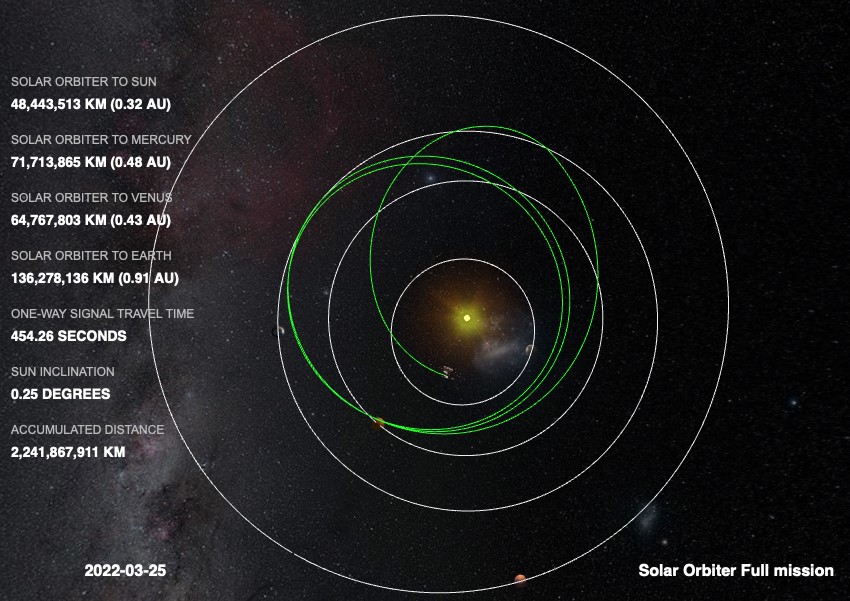
Orbit of Solar Orbiter (in green) since its launch. The final position of the satellite corresponds to the fourth perihelion which took place on March 26, 2022. You can explore these orbits by hand at https://solarorbiter.esac.esa.int/where/
The Solar Orbiter mission, launched on February 10, 2020 from Cape Canaveral has already traveled more than 2 billion km. Since its passage just 470 km above the Earth in November 2021, the science mission has officially begun. On March 26, 2022, Solar Orbiter passed within 0.32 astronomical units of our star (about 1/3 the distance from Earth to the Sun) for its fourth perihelion (the point in its orbit where Solar Orbiter is closest to the Sun) at a speed of 198,000 km/h. On this occasion, all 10 instruments onboard will be jointly switched on and pointing towards our star. As the cycle 25 of magnetic activity of the Sun is in full rise of intensity, it is highly probable that many eruptive events will be observed with the STIX telescope (Spectrometer Telescope for Imaging X-rays) whose detectors, the Caliste-SO, were conceived, realized and qualified at CEA.
On the occasion of this 4th perihelion, this milestone delivers one of the first X-ray images from STIX as well as new simulations of the Solar model from a DAp team, which have given rise to recent articles (see end of page)
Observing X-ray flares with STIX
The STIX instrument was switched on on April 14, 2020. The instrument's in-flight acceptance lasted three months, with the Sun still quiet (the minimum of the previous cycle 24 having occurred in December 2019).
"After exhaustive testing, we determined the optimal parameters for routine operation of the instrument and performed its energy calibration. Since January 1, 2021, STIX has been in continuous operation and transmitting data to us daily. 100% of the pixels of the 32 Caliste-SO detectors (384 pixels) are working perfectly, at nominal performance. They record, one by one, X-ray photons between 4 keV and 150 keV", says Olivier Limousin, a member of the international STIX team.
Over the past 2 years, nearly 4000 flares have been observed as solar activity increases. The data are available and the sophisticated spectro-imaging software is ready for the scientific community to use.
Every day, the DAp STIX team (IRFU/CEA), in conjunction with the STIX core-team, monitors the proper operation of the detectors, their calibration, and their stability in flight. "Beyond the purely technical aspect, we contribute our intimate knowledge of the detectors to the optimization of the processes and means of scientific analysis of the instrument," continues Olivier Limousin.
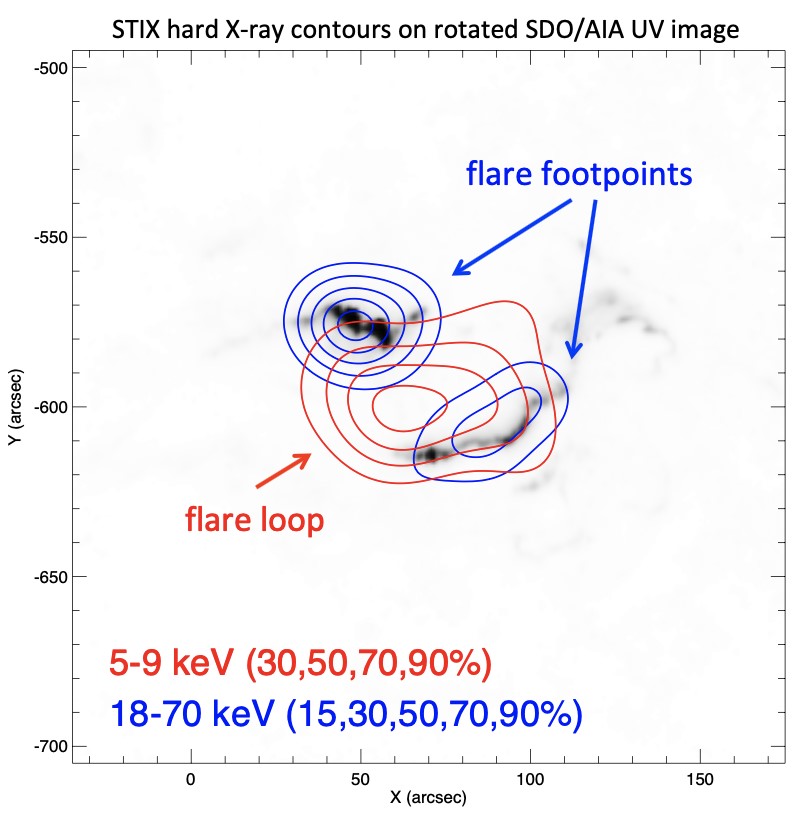
The figure opposite represents one of the first X-ray images taken with the STIX imager. It is an intense "X-class" solar flare. The location of the two X-ray energy components (red and blue contours) are morphologically consistent with the UV images provided by the AIA (Atmospheric Imaging Assembly) instrument of the SDO (Solar Dynamic Observatory) satellite.

Solar Orbiter STIX observations of the first very large (X-class) flare on October 28, 2021: STIX contours in the thermal (red) and non-thermal (blue) X-ray range are plotted on a UV SDO/AIA image, revealing that the higher energy X-rays originate from the same location as the UV emission (i.e., from the flare strips) while the thermal emission originates from the flare loop connecting the flare strips. - Credit: S. Krucker, STIX PI.

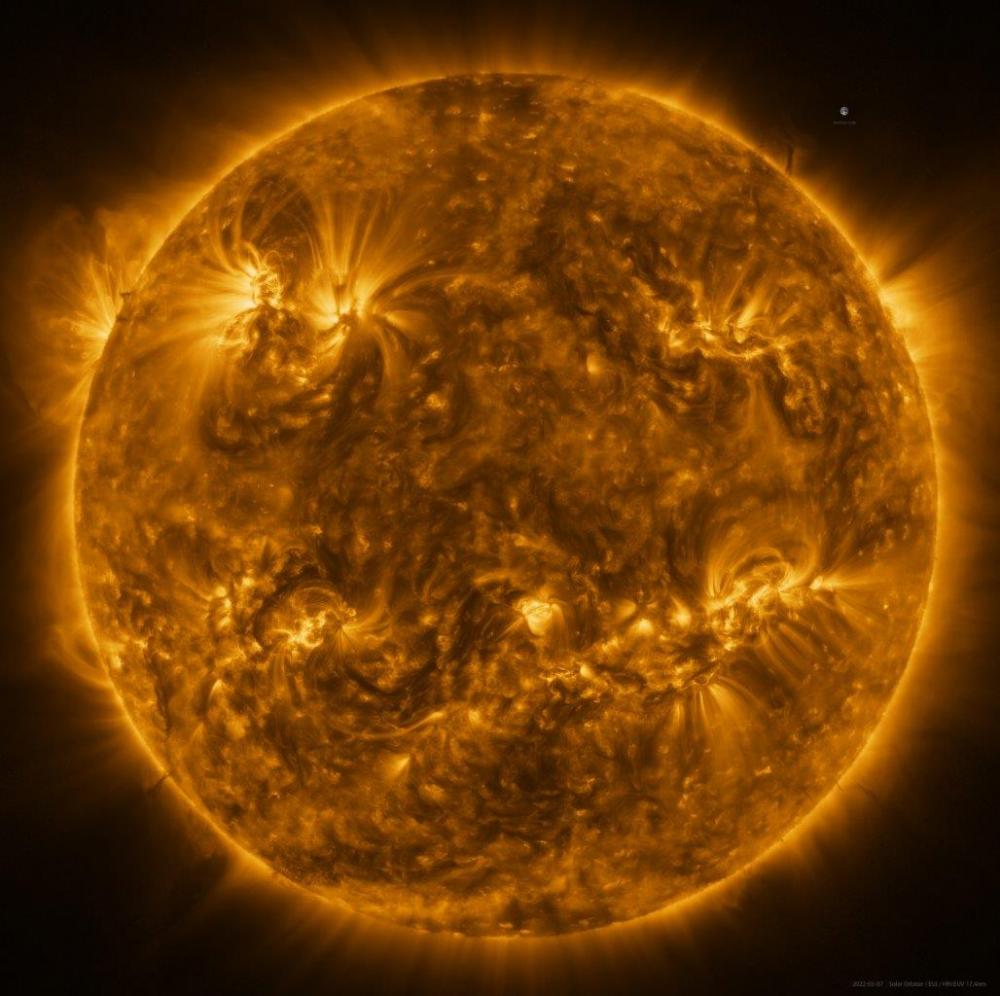
Extreme UV image (EUI instrument), at the highest resolution ever made of the complete disk of the Sun. Credit: ESA & NASA/Solar Orbiter/EUI team; Data processing: E. Kraaikamp (ROB). link to HD: here
“X” scenario of a solar flare
A magnetic arch is filled with gas that has been heated by the energy released during a flare. The observed X-ray spectrum allows to determine the temperature of these loops.
The component, in blue, are hard X-ray photons that come from electrons. The electrons accelerated during the energy release process of the flare "hit" the solar surface and emit hard X-rays. They heat the lower layers of the solar corona. The blue component is called non-thermal radiation. The heated material then fills the flare loops. By heating the solar surface, the electrons give up their energy and heat the gas which is then visible in low energy X-rays.
The red curve (thermal radiation) increases during the periods when the blue curve (non-thermal radiation due to the acceleration of electrons) reaches its maximum. After the acceleration stops, the eruptive loops start to cool down and the X-ray emission decreases accordingly
A 3D model of the Sun and its environment
Allan Sacha Brun and Antoine Strugarek are members of the Solar Orbiter Data Analysis Working Group (MADAWG) which provides numerical simulations and software for data analysis.
Antoine Strugarek explains: "In parallel, our teams are working on the interpretation of solar observations through high performance numerical simulations in an observational context. For this, we have developed a post-processing tool coupling the numerical simulation outputs to spectral databases such as Chianti, allowing us to produce images in UV, white light and of course soft X-rays of our simulations (hard X-rays are related to non-thermal).”
This background work allows first of all to tune the fine details of the coronal heating necessary to make the solar environment so hot (beyond the million degrees K). "This heating is controlled here by the amplitude of the Alfvén waves excited at the photosphere that we have to prescribe in the model" continues Antoine.
Comparisons between observations and simulations have shown that solar flares draw their energy from the often twisted magnetic structures that have emerged on the surface of our star. Through these models and their visualization in observable spectral bands, scientists can reveal the magnetic and thermodynamic structures underlying solar flares.

The LDE3 team is working on the improvement of local (for the detail of solar flares) and global (for the structuring of the heliosphere) physics models, which will ultimately lead to a direct comparison between the simulations and the spectro-images obtained with STIX.
The scientists have set up a weekly weather report of the activity of our star that can be shared here. These bulletins are distributed on a mailing-list to which you can join if you wish by sending an email to .
Contacts Irfu:
Olivier Limousin, Aline Meuris, Allan Sacha Brun, Antoine Strugarek
STIX articles:
- Astronomy & Astrophysics February 2022 “First hard X-ray imaging results by Solar Orbiter STIX”
- A&A 656, A4 (2021) STIX X-ray microflare observations during the Solar Orbiter commissioning phase
- A&A (2019) Count-based imaging model for the Spectrometer/Telescope for Imaging X-rays (STIX) in Solar Orbiter
modelisation articles :
- Parenti et al. 2022, The Astrophysical Journal, http://arxiv.org/abs/2203.10876
• Structure and evolution of the Universe › Planets, star's formation and dynamics, interstellar medium
• Institute of Research into the Fundamental Laws of the Universe • The Astrophysics Division (DAp)
• Laboratory Dynamics of Stars, (Exo)-planets and their Environment • Space Systems and Architectures laboratory • Spectral-imaging laboratory for space science


