Spin alignment of stars in old
open clusters
Enrico Corsaro, Yueh-Ning Lee, Rafael A. García,
Patrick Hennebelle, Savita Mathur, Paul G. Beck, Stéphane Mathis, Dennis Stello & Jérome Bouvier
Nature Astronomy, March 13 2017

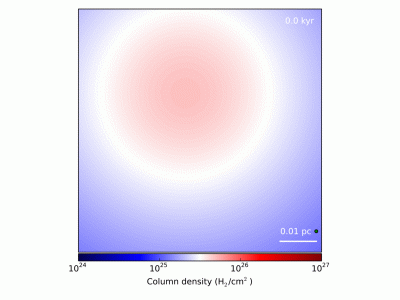
Simulation showing the formation dynamics during the first 10 kyr, with yellow circles corresponding to massive stars.
The data used to produce the results shown in the paper are divided in three bundles, each one compressed into a tar.gz format. Each data bundle contains also a README file explaining the data structure and content of the data files. Additionally, we provide two more data bundles that contain the results of the comparison with the measurements published by Meibom et al. 2015.
-
The data bundle Data_Bundle_LightCurves.tar.gz contains all the light curves corrected for the asteroseismic analysis, as described in the Methods section of the manuscript.
- The data bundle Data_Bundle_PowerSpectralDensity.tar.gz contains all the power spectral densities used for the analysis of the stellar oscillations.
- The data bundle Data_Bundle_PeakBagging.tar.gz contains the detailed asteroseismic properties of frequency, amplitude (or height), and linewidth, of each rotationally split l=1 mixed mode selected for the measurement of the stellar-spin inclination. The Bayesian detection probability is also provided for all the oscillation mode components with low signal-to-noise ratio, as reported in the Methods section of the manuscript.
- The data bundles Comparison_PDC_KADACS_Meibom2015.tar.gz and UKIRT_Images_Meibom2015.tar.gz contain the results from our new reanalysis of the rotational periods for the sample of stars investigated by Meibom et al. 2015 and the UKIRT images for targets showing potential pollution by nearby stars.

