

After last year’s discovery of the large-scale cosmological structure Ho’oleilana, using only galaxy positions from the Cosmicflows-4 catalog, it is now the analysis of their velocities that is the focus of this new publication, offering multiple insights.
Galaxies are subject to two opposing phenomena: on the one hand, due to the expansion of the Universe, they move away from each other at a speed proportional to their mutual distances—this is the Hubble Law. On the other hand, and in the opposite direction, gravity causes them to fall toward one another, aggregating into structures such as groups or clusters of galaxies, while also forming vast coherent motions known as cosmic flows.
The new Cosmicflows-4 catalog lists the distances and velocities of 56,000 galaxies. Compared to its previous version, it includes a significant number of measurements from the SDSS-PV sample (Sloan Digital Sky Survey–Peculiar Velocities) in the Northern Galactic region—an area that had remained Terra Incognita for cosmic flows. Beyond the new data, this study also benefits from an algorithmic innovation: the implementation of a Hamiltonian Monte Carlo (HMC) method, producing a chain of states, each representing a possible reconstruction of the density and velocity fields consistent with the measurements and their uncertainties, within the framework of the standard cosmological model. Researchers can then analyze the average of all these realizations, or—as done here for the first time—use them in a probabilistic approach to cosmographic mapping.
In detail, 1,000 realizations were generated and used in this study—a performance made possible by running the HMC algorithm on GPUs in parallel, reducing computation time by two orders of magnitude.
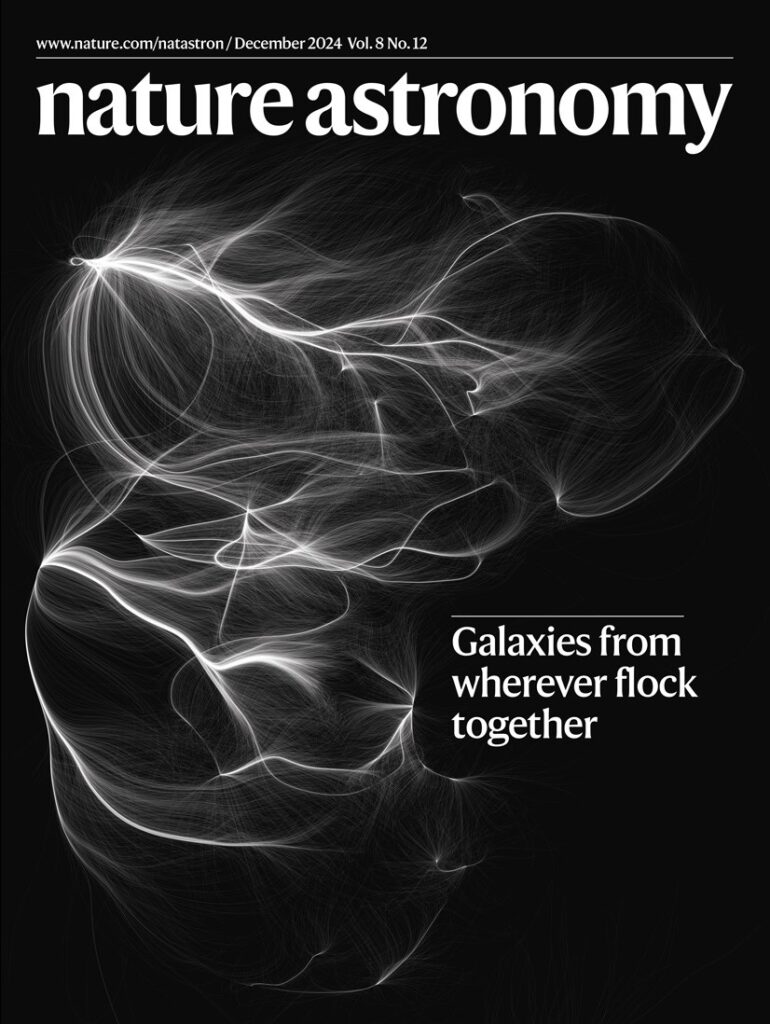
The map of cosmic flows featured on the cover of Nature Astronomy shows the mean velocity field from these thousand states, visualized through streamlines. It spans, from bottom to top, a range of two billion light-years. Major patterns emerge: multiple attractors, which are points where flow lines converge. Two attractors stand out: the well-known Shapley attractor—familiar to our teams—located at mid-left, forming a vast basin of attraction incorporating smaller structures; and, appearing for the first time in terms of cosmic flows, at the top of the map, a region dominated by one of the largest structures in the Universe: the Sloan Great Wall, discovered in 2005 in SDSS data. Here, it manifests as an immense basin of attraction, though only partially reconstructed, as its attractor lies at the edge of the region covered by our data.
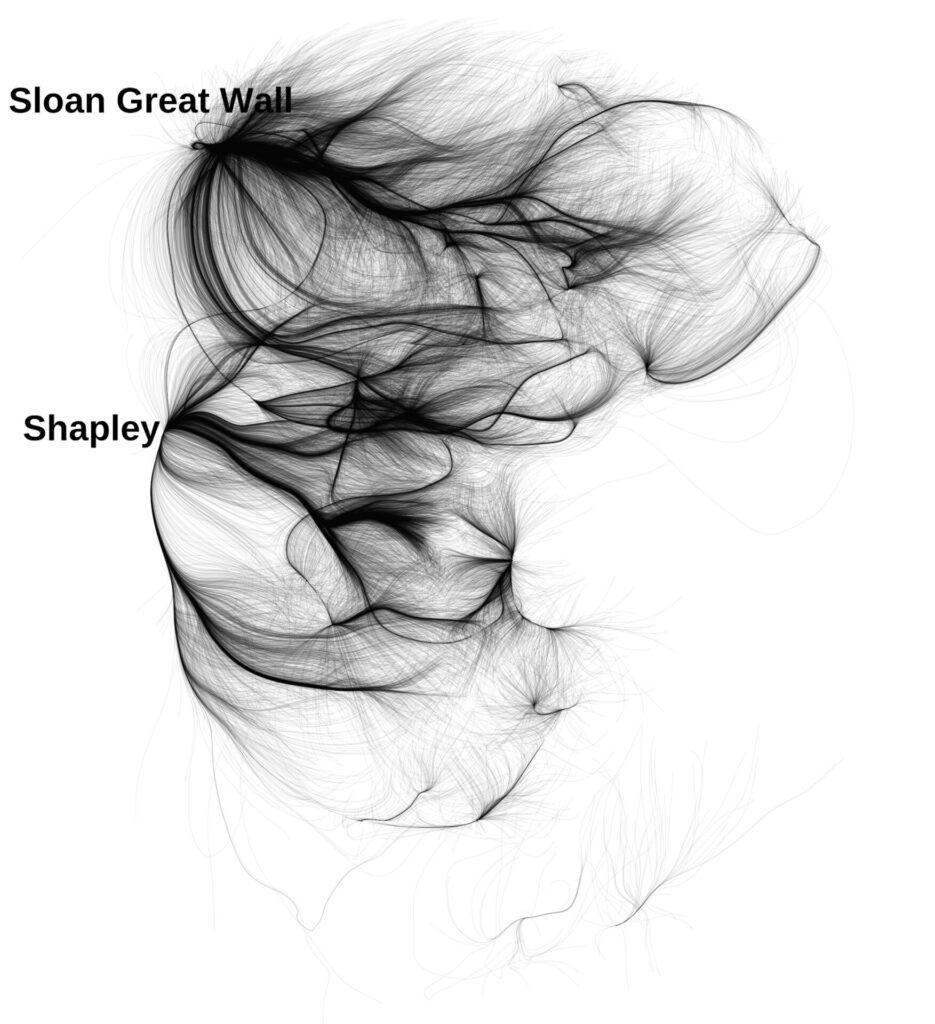
One of cosmology’s key quests is to reach what is called The End of Greatness—the largest structure in the observable Universe. In the context of cosmic flows, this means identifying the largest basin of attraction our maps can reveal. This study shows we are still far from that “End of Greatness”! Beyond mapping basins of attraction, the map also reveals something quite extraordinary: a large-scale trend—already partially known—where cosmic flows move from right to left on the map, roughly from celestial north to celestial south, as if influenced by an even larger structure.
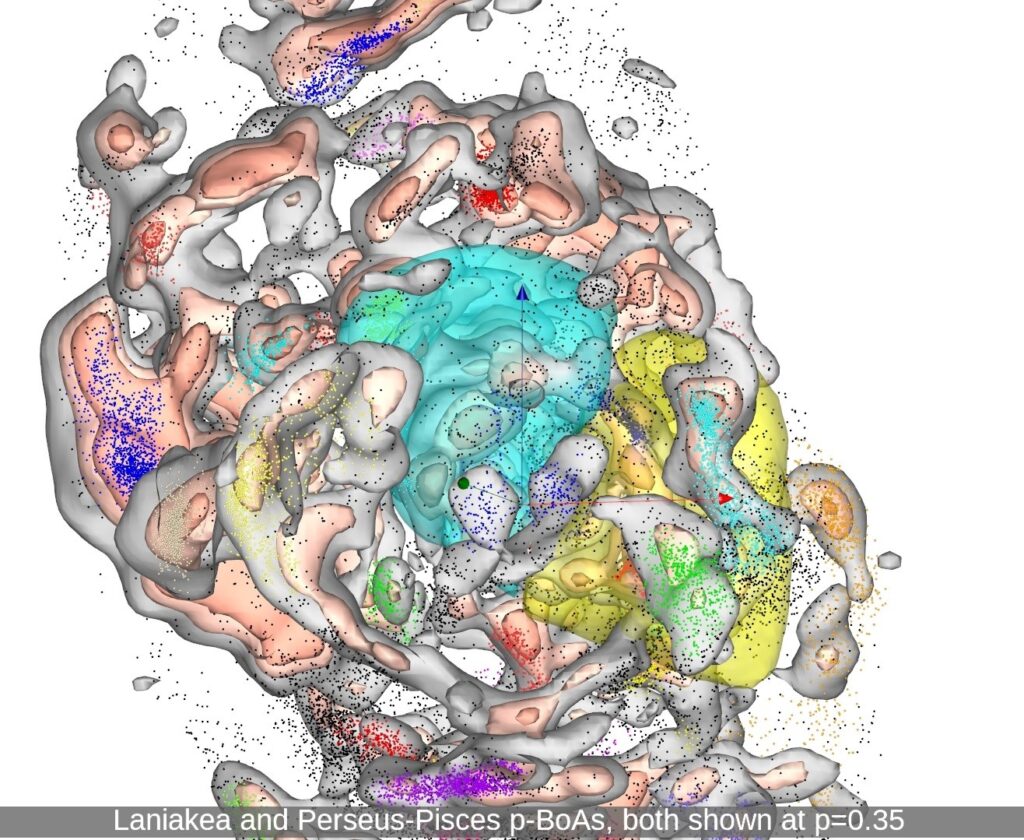
Another breakthrough in this paper is the probabilistic approach to the concept of a basin of attraction. This method examines in detail the velocity field of each of the 1,000 reconstructions, generating flow lines whose endpoints form clusters of points, as shown in the figure above. A machine learning clustering algorithm identifies the main attractors in this distribution. It is then possible to determine, for any point in space, the probability that its flow line ends in one attractor or another. Each attractor lies at the center of its probabilistic basin of attraction (p-BoA), visualized with constant-probability isosurfaces. In the figure above, the probabilistic basins are shown at a probability threshold of 35% for Laniakea—the large structure our galaxy belongs to—and for Perseus–Pisces, its neighboring structure.
This approach makes it possible to quantify the extent to which our galaxy belongs to the Laniakea basin of attraction, as well as to a larger, hierarchically more significant basin centered on the Shapley Concentration.
A video produced for the article illustrates these points: https://vimeo.com/963076278
Contact : Daniel Pomarede