ESA Space science image of the week (Oct. 8th, 2018)
A survey of the Universe, XXL size
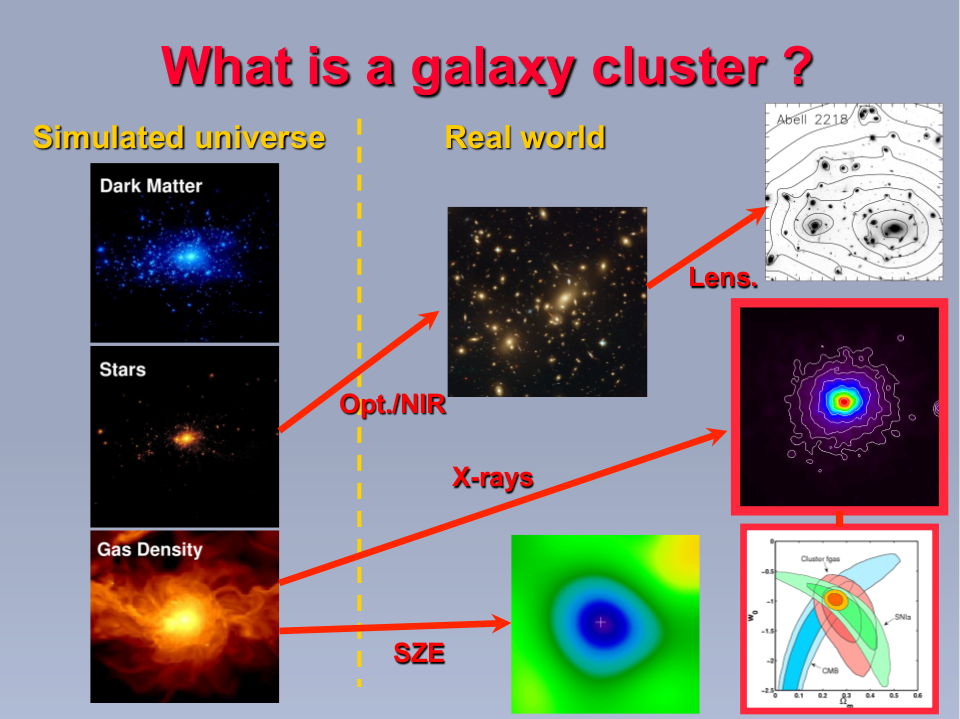
- What are the XXL clusters (2012)?
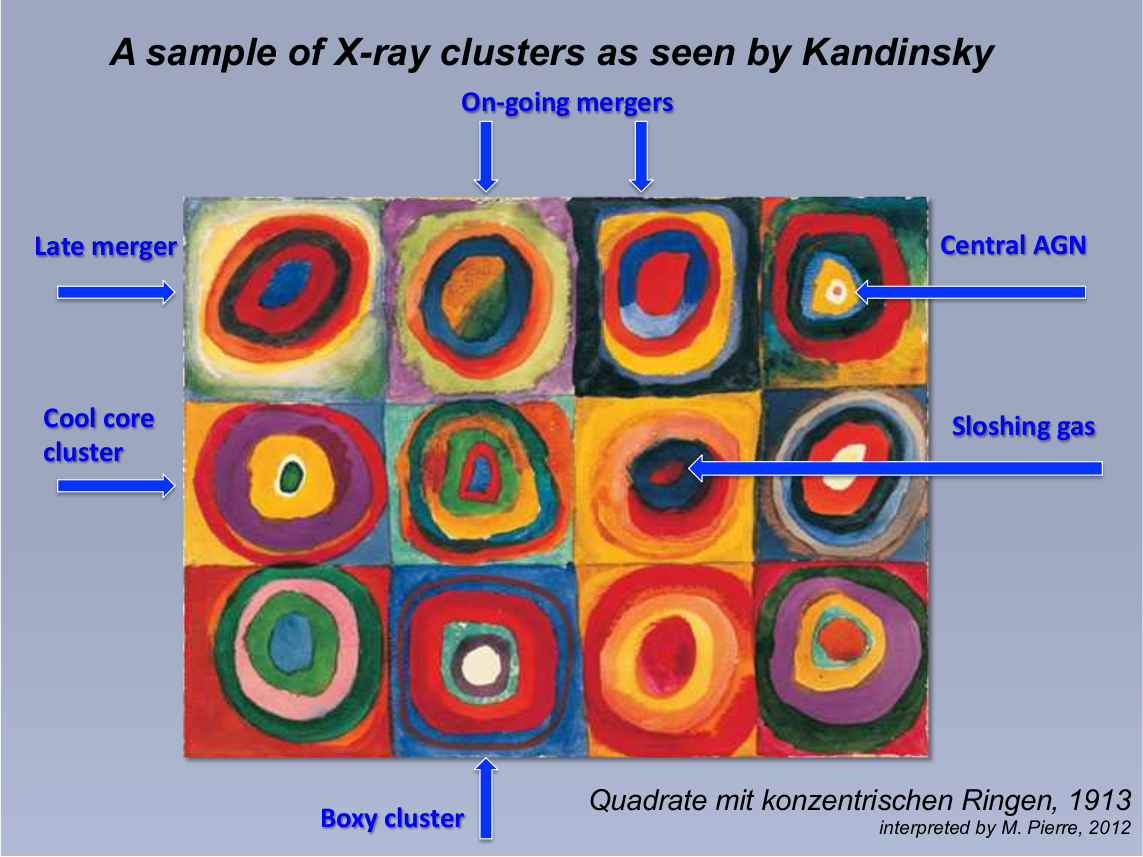
- A century of X-ray cluster astronomy (1913-2013)
"Interactive Visualization of 3D Redshift Surveys with SDvision"
by D. Pomarède and M. Pierre
Published in the Proceedings of the IAU Symposium 277 Tracing the Ancestry of Galaxies
(on the land of our ancestors), 2010,Vol.6, Symposium S277, p.154,
Cambridge Journals, ed. C. Carignan, F. Combes, K.C. Freeman.
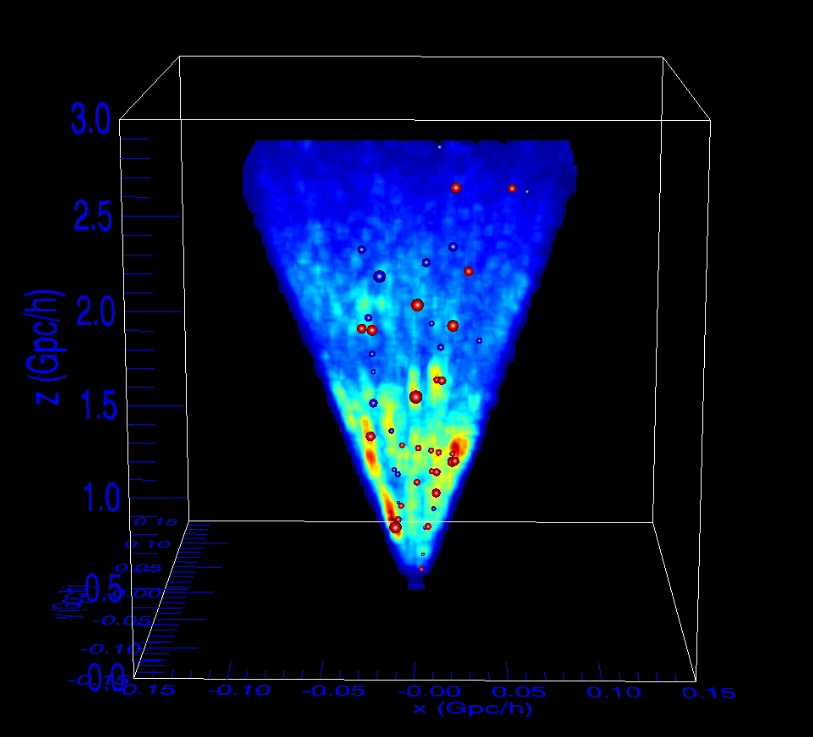
Visual comparison of the XMM-LSS and CFHTLS Surveys.
Click this picture to download the video (20.8Mb)
The three-dimensional visualization of redshift surveys is a key player in the comprehension of the structuration of the cosmic web. The SDvision software package, intended primarily for the visualization of massive cosmological simulations, has been extended to provide an interactive visual representation of different classes of redshift surveys, with the objective to enable direct comparisons between the rare highest-density peaks traced by the clusters of galaxies found in the XMM-LSS Survey and the densely populated catalogues of galaxy photometric redshifts. We present the various possibilities offered by this tool in terms of filtering of the data, reconstruction of density fields, interactivity and visual rendering, including various techniques such as ray-casting, isosurfaces, slicing and texturing. This is illustrated using the C1 and C2 samples of the XMM-LSS Survey, and the publicly released COSMOS and CFHTLS photometric redshift Catalogs. Comparisons with published results are presented and discussed. (download pdf)


