A quick way to look at data is to compute 2D data slice map.
Here is how it works: It first gets some sample points from a camera object, using a basic 2D Cartesian grid. Then those points are evaluated using the pymses point_sampler module. A sampling operator can eventually be applied on the data.
We first need to define a suitable camera:
from pymses.analysis.visualization import Camera
cam  = Camera(center=[0.5, 0.5, 0.5], line_of_sight_axis='z', region_size=[1., 1.],\
    up_vector='y', map_max_size=512, log_sensitive=True)
Using the amr data previously defined in AMR data access, we can get the map corresponding to the defined slice view. A logarithmic scale is here applied as it is defined in the camera object.
from pymses.analysis.visualization import SliceMap, ScalarOperator
rho_op = ScalarOperator(lambda dset: dset["rho"])
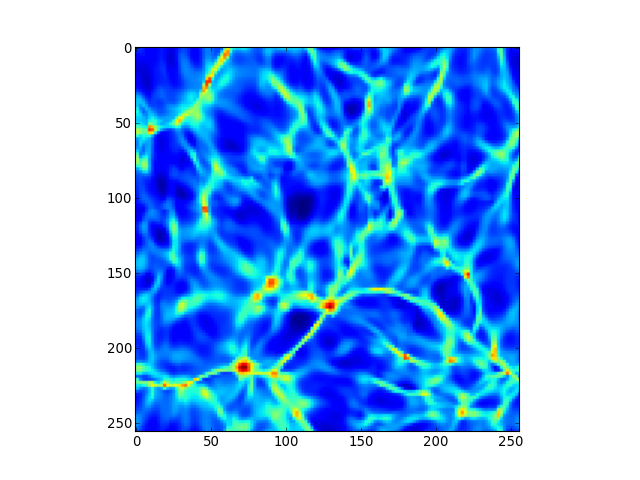
map = SliceMap(amr, cam, rho_op, z=0.4) # create a density slice map at z=0.4 depth position
The result can be seen using the matplotlib library:
import pylab as P
P.imshow(map)
P.show()
(Source code, png, hires.png, pdf)