

Fast method for Weak Lensing Statistics and map making
The analysis of weak lensing data requires to account for missing data such as masking out of bright stars. To date, the majority of lensing analyses uses the two point-statistics of the cosmic shear field. These can either be studied directly using the two-point correlation function, or in Fourier space, using the power spectrum. The two-point correlation function is unbiased by missing data but its direct calculation will soon become a burden with the exponential growth of astronomical data sets. The power spectrum is fast to estimate but a mask correction should be estimated. Others statistics can be used but these are strongly sensitive to missing data.
The solution that is proposed by FASTLens is to properly fill-in the gaps with only NlogN operations, leading to a complete weak lensing mass map from which we can compute straight forwardly and with a very good accuracy any kind of statistics like power spectrum or bispectrum. We propose also a new method to compute fastly and accurately the power spectrum and the bispectrum with a polar FFT algorithm.
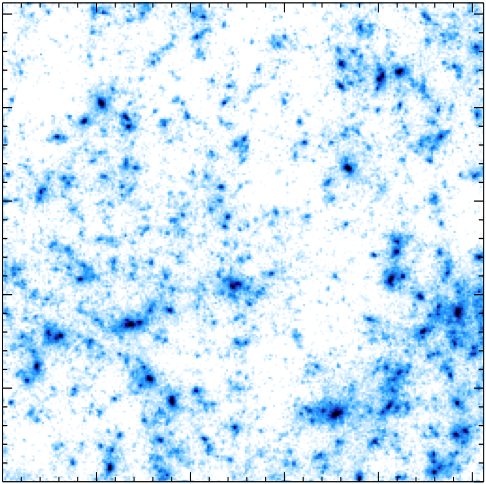
Fig. 1: Simulated weak lensing mass map for a ΛCDM cosmological model with σ8= 0.9 and Ωm = 0.3. The region shown is 1° x 1°.
With increasingly large data sets weak lensing measurements are able to measure cosmological parameters with ever greater precision. However this increased accuracy also places greater demands on the statistical tools we use to extract the available information. Due to the fact that lensing surveys contain missing data, for instance the masking of bright stars, direct measurement of the correlation function, through pair counting, is widely used since this method is not biased by missing data. However, this method is computationally intensive, requiring O(N^2) operations. It is therefore not feasible to use it for future ultra-wide lensing survey. Measuring the power spectrum is significantly less demanding computationally, requiring O(NlogN) operations, but is strongly affected by missing data. In order to lower the impact of the gaps on statistics measurement, we developed an algorithm based on sparse representation of the data, to fill in and interpolate across the masked regions. It requires approximatively O(NlogN) operations which will enable to keep up with the expected exponential increase in astronomical data. This method relies strongly on the notion of sparsity and on the construction of sparse representations in large redundant dictionaries. N-body simulations have been used to validate the method that is proposed and we have chosen typical mask patterns to control the impact of gaps in weak lensing analysis. The gaps in the data we created (Fig. 2 on the left) need to be correctly taken into account.
Image inpainting also termed image interpolation consists in restoring an image from a destroyed or consciously masked subregion of the image. It means restoring missing image information by infering a maximum of information from the remaining data. The term "inpainting" has been circulating among museum restoration artists for a long time. Recently, considerable interest has been generated for the digital inpainting problem in the applied mathematics community that have shown that mathematical tools such as variational principles and partial differential equations (PDE) perform well. More recently, Elad (2005) introduced a new inpainting approach relying on sparse representation of both texture and cartoon image contents. This algorithm is a direct extension of MCA (Morphological Component Analysis) (Starck 2005) that allows the separation of features contained in an image when these features present different morphological aspects. Following the last approach, the key to our inpainting method is the notion of sparsity. It means the method relies on the assumption that it exists a sparse representation of the data.
Representing the image to be inpainted in an appropriate sparse dictionary is the main issue. We are interested in a large and overcomplete dictionary that can be built by the union of several sub-dictionaries, each of which must be particularly suitable for describing a certain feature of a structured signal. Finding a sparse representation for weak lensing analysis is challenging. It means finding a sparse representation to describe each of the features of the data. The weak lensing signal is composed of clumpy structures such as clusters and filamentary structures such as walls. The weak lensing mass maps exhibit both isotropic and anisotropic features. The basis that better represent isotropic objects are not the same as those that better represent anisotropic ones. Surprisingly the sparsest representation for weak lensing data is obtained with a local DCT. More sophisticated representations recover clusters well, but neglect the weak lensing texture. Even combination of local DCT with another dictionary (isotropic or not) is less competitive. We choose DCT in the rest of our analysis. (See the result of inpainting Fig. 2 on the right).
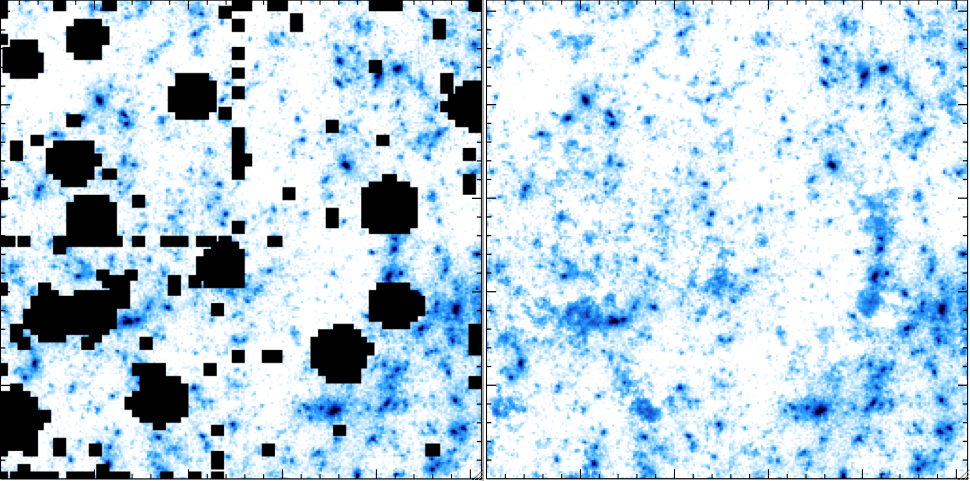
Fig. 2: Simulated mass map with the mask pattern of CFHTLS data on D1 field (on the left), inpainted maps map (on the right).
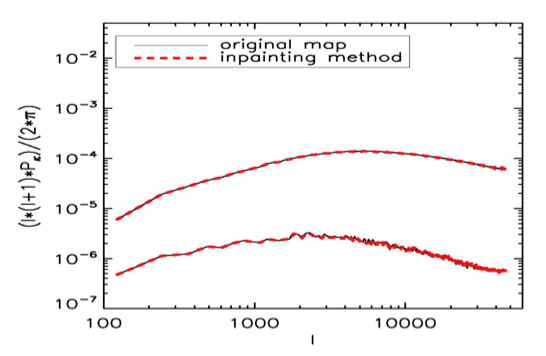
Fig. 3: Power spectrum recovery from convergence maps for CFHTLS mask: the two upper curves (almost superposed) correspond to the mean power spectrum computed from i) the complete simulated weak lensing mass maps (black - continuous line) and ii) the inpainted masked maps (red - dashed line), and the two lower curves are the empirical standard deviation for the complete maps (black - continuous line) and the inpainted masked maps (red - dashed line).
One of the central goals of weak lensing analysis is the measurement of cosmological parameters. To constrain the large scale structures, the power spectrum Pκ of the convergence κ and thus its two-point correlation function Cκκ , contains all the information about the primordial fluctuations. To characterize the non-gaussianity at small scales due to the growth of structures, higher-order statistics like three-point statistics have to be used. To lower the impact of the mask, we have applied the proposed algorithm. Then we have conducted several experiments to estimate the quality of the method.
In Fig. 3, the mean power spectrum is estimated from 100 simulated mass maps. The MCA-inpainting algorithm was applied with 100 iterations and using always one single representation the local DCT on the incomplete shear maps. The comparison between the mean power spectrum estimated from the inpainted mass maps and from complete mass maps reveals no significant discrepancy. The mean error that is made in the estimation of the power spectrum is about 1%.
In Fig 4, the mean bispectrum is estimated from 100 simulated mass maps. The comparison between the mean bispectrum estimated from the inpainted mass maps and from complete mass maps reveals no significant discrepancy. The mean error that is made in the estimation of the bispectrum is about 3%
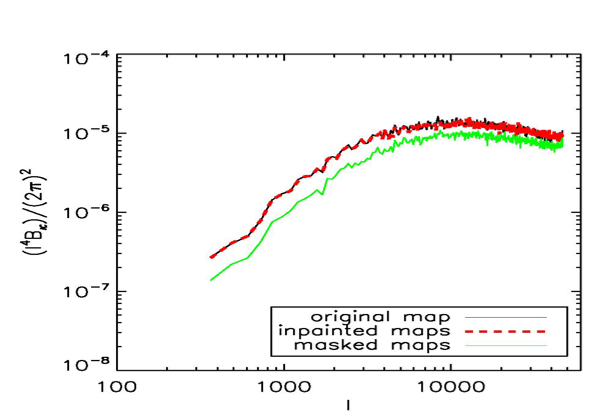
Fig. 4: Bispectrum recovery for CFHTLS mask: the two upper curves (almost superposed) correspond to the mean equilateral bispectrum computed from i) the complete simulated weak lensing mass maps (black - continuous line) and ii) the inpainted maps from masked shear maps (red - dashed line), and the lower curve correspond to the mean equilateral bispectrum computed from the incomplete shear maps (green - continuous line).
FAST STATISTICS ESTIMATION :
Assuming the gaps are correctly filled, the field becomes stationary and the Fourier modes uncorrelated. The FASTLens software includes a new method to calculate the power spectrum and the equilateral bispectrum accurately and efficiently. To compute the bispectrum, we have to average Fourier coefficients along a radius. It requires some approximations to interpolate the Fourier coefficients in this kind of equispaced Cartesian grid. In order to avoid these approximations, a solution consists in using a recent method, called polar Fast Fourier Transform (polar FFT) that is a powerful tool to manipulate the Fourier transform in polar coordinates. We have used this polar Fast Fourier Transform, to compute a very accurate power spectrum and equilateral bispectrum.
USER GUIDE :
The user manual introduces the missing data problem in statistic estimation and presents the available routines. An accurate description of IDL routines is given.
DOWNLOAD FASTLens :
The IDL FASTlens software requires IDL (version 6.0 or later) to be installed on your computer. The binaries C++ called by IDL routines are not available under all the systems therefore you cannot use the package on all platforms.
Statistic routines: The supported platforms are : PC-Linux (32 and 64 bits), Mac OS X (Intel and PowerPC).
New : The estimation of bispectrum for isosceles configurations has been recently added !
Have a look at the following paper :
FASTLens (FAst STatistics for weak Lensing) : Fast method for weak lensing statistics and map making, S. Pires, J.-L. Starck, A. Amara, A. Refregier and J. Fadili, MNRAS, 395, 1265-1279, 2009
Last modified on 2nd September 2009 by Sandrine Pires
For questions send an email to
• Le Département d'Astrophysique (DAp) // UMR AIM • Le Département d'Électronique des Détecteurs et d'Informatique pour la Physique (DEDIP)
• Laboratoire d'ingénierie logicielle pour les applications scientifiques (LILAS)
• DUNE
