

Launched in 2020, Solar Orbiter reached a historic milestone on March 24, 2025, when it reached a sufficiently inclined orbit for the first time to observe the Sun’s poles with its multiple cameras. Solar Orbiter thus becomes a formidable tool for studying the Sun in all its facets, from its poles to its far side. Thanks to these unprecedented observations, the teams hope to refine their knowledge of the Sun’s cycle, in particular the reversal of its magnetic field, to better model “solar weather” by taking into account structures that are not visible from Earth, but which influence solar winds, and also to study “activity nests” such as the one observed by the teams for several months, which are at the origin of numerous solar flares.
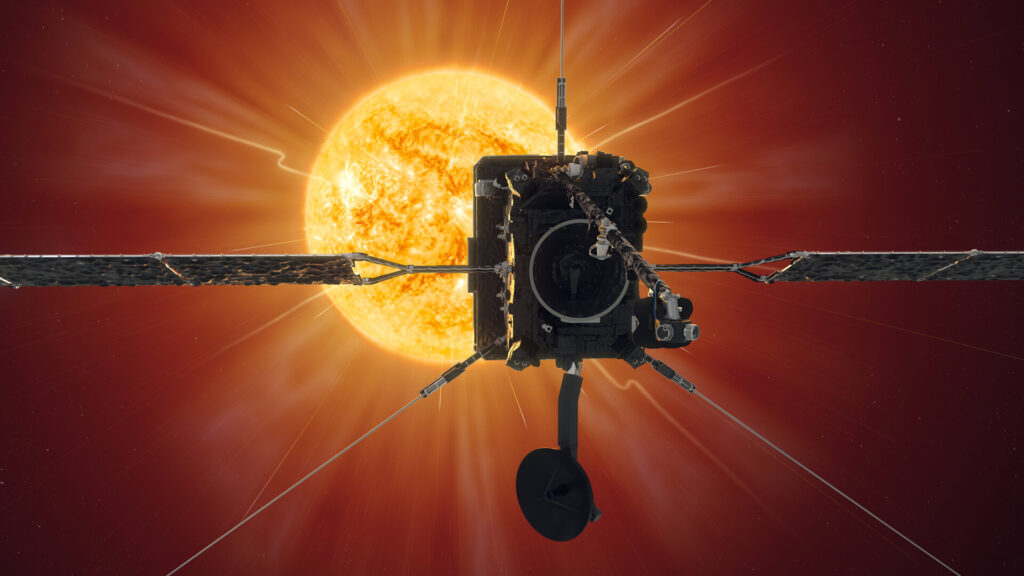
On February 18, 2025, Solar Orbiter performed its 5th gravitational assist (its 4th with the planet Venus) to modify its orbit and increase its angle of inclination to the ecliptic plane (the virtual plane passing through the center of the Earth and Sun). The operation was successful, bringing the probe very close to the planet; within 400 km of its surface in order to change its orbit. With this inclined orbit, it is now possible to better observe the solar poles, which is, in the spring of 2025, ideal as the solar cycle reaches maximum activity (cycle 25 began in December 2019).
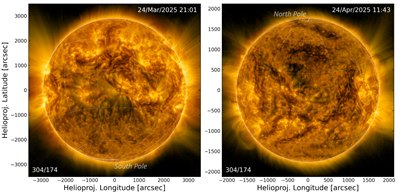
In fact, it’s during periods of solar maximum when the Sun is covered with spots in a band centered around the solar equator, as it is at the moment, that the global dipolar-dominated magnetic field reverses. Observing the poles will provide more precise information on this phenomenon, thanks to a complementary and more appropriate viewpoint. Being able to observe this process directly over the years to come with Solar Orbiter and its suite of 10 instruments will be spectacular. Figure 1 shows a view of the Sun’s south and north poles, taken by the EUI instrument on March 24 and April 24, 2025 respectively.
Observations of the poles and high latitudes, increasingly realistic simulations
The gravitational assistance of March 17 is clearly apparent in Figure 1, with the Sun’s poles becoming increasingly visible. In order to anticipate the dynamics of the Sun’s pole, researchers at CEA Paris-Saclay performed new HPC (High Performance Computing) simulations of solar turbulent convection rotating at high Reynolds numbers, which transports the energy created at the Sun’s core to the surface. This allows a better understanding of the energy distribution of convective motions as a function of different length scales and to identify possible structures in these high-latitude regions (like the vortical structures seen in the poles of Jupiter or Saturn; Noraz et al. 2025).
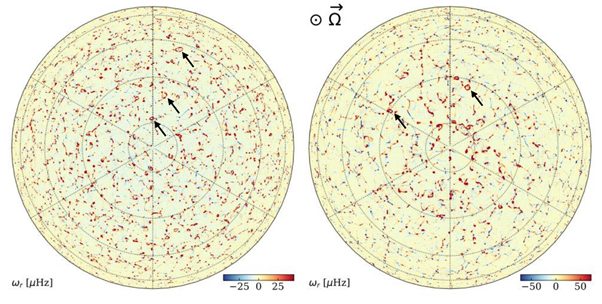
Thanks to the ASH code, the research team could simulate convective flows across the entire Sun in detail, including those passing through the poles. We show in Figure 2 the vorticity (a quantity deduced from the convective velocity quantifying the degree of helicity in the fluid flow) in this new realistic model of the Sun, which satisfies all helioseismic constraints (differential rotation prograde, reduced power of large convective scales, controlled super-adiabaticity). We see that, in addition to the usual convective structures, vorticity rings concentrating a high degree of helicity appear, as indicated by the small black arrows.
Their appearance is due to the alignment of the rotation axis with gravity, in contrast to equatorial regions where the two vectors tend to be perpendicular to each other. This concentration of rotation results in the appearance of these intense vortical structures, which can cluster together in the form of helical filaments. Solar Orbiter’s data will enable us to confirm or refute the presence of these vortices, and thus advance our understanding of solar turbulence.
A “hidden” face revealed in real time, an asset for space weather forecasting
Not only is Solar Orbiter beginning to enable us to observe the Sun’s poles, but since its launch in 2020, it has been giving us a unique view 6 months a year of the far side in relation to the Earth. Of course, unlike the Moon, this hidden face is not immutable and varies constantly: as the Earth and Sun are not synchronous, and the Sun rotates every 28 days, the structures present on this hidden face will be visible between 7 and 14 days later. However, by having a continuous view of both sides of the Sun, we can cover 360° in longitude, enabling us to understand the global state of solar activity at a given time, and thus better anticipate solar activity. In Perri et al. 2024, we published a study on the influence of far side information on the state of the corona, wind and heliospheric neutral layer.
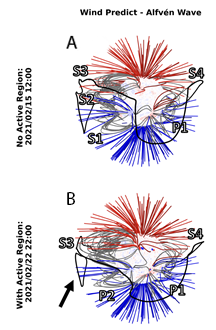
Without observations of the Sun’s far side, as provided by Solar Orbiter in Figure 3, Earth is blind to the potential impacts of dangerous solar activity, which can quickly appear on the horizon and damage satellites and other networks. Researchers from CEA Paris-Saclay, IRAP and IAS, sought to better understand the impact that undiscovered far side active regions could have on Sun to Earth space weather modelling. The research team drove a range of solar wind models with different physical assumptions (WindPredict developed by CEA Paris-Saclay and collaborators) using observations of the Sun that either did and did not include the far side active region, shown in Figure 3.
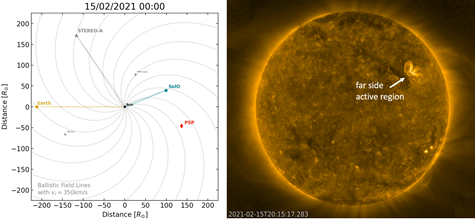
Despite the small size of this active region, the research team showed that its inclusion in the models produced a global change in the structure of the Sun’s atmosphere and wind, as shown in Figure 4. This change was characterized using multi-wavelength observations of the Sun (UV, white-light, etc.), and by developing realistic indicators within the numerical simulations to generate data compatible with the observations provided by Solar Orbiter. Since this initial study, solar activity has increased, making it now even more important to monitor far side active regions. In future, ESA’s upcoming Vigil mission, in which CEA Paris-Saclay researchers are involved, will provide an early warning of potentially hazardous features rotating into Earth view; the spacecraft will be stationed at the 5th Lagrange point (it will see what the Earth will have seen about 7 days before).
Researchers from CEA Paris-Saclay used observations from Solar Orbiter along with complementary data from near-Earth satellites to investigate the distribution of magnetic activity across the Sun (Finley et al. 2025). They focused on regions where intense magnetic fields frequently emerge in close proximity to one another, forming so-called activity nests. Figure 5 shows an activity nest from 2022, for which the clustering of magnetic activity was evident in extreme-ultraviolet wavelengths. The research team tracked the magnetic activity and solar flares from this activity nest near-continuously from April to October 2022.

Figure 6 shows two solar eruptions observed during this period, highlighting the advantage of Solar Orbiter’s far side position in capturing events not visible from Earth. Panel a) shows a flare seen by both GOES (near-Earth satellite) and STIX (Solar Orbiter), while the flare in panel b) was only observed by STIX on the far side.

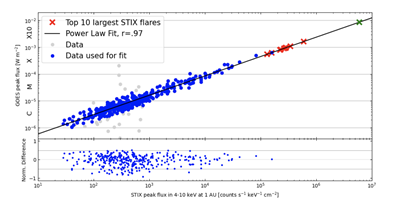
Intercalibration of these instruments is necessary to compare the solar activity measured by different satellites. Recently, Stiefel et al. 2025 in collaboration with CEA, performed a thorough calibration of the background detector on board STIX, in order to produce a reliable transformation between the x-ray counts from STIX into their corresponding flux if observed by GOES (near-Earth). Figure 7 shows the power-law relationship produced by the research team using the 500 largest solar flares observed between February 2021 and April 2023 (blue dots). Using this approach, the largest flare that can be reliably transformed is X85 (green cross). The ten largest flares observed by STIX up until July 2024 are shown with red crosses (using the power law fit).
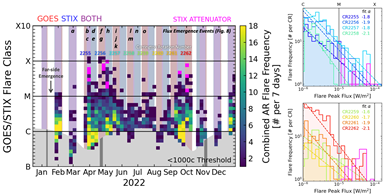
With the combination of observations from Solar Orbiter and near-Earth satellites, the CEA Paris-Saclay team was able to study the distribution of solar flares from the long lasting activity nest identified in 2022 by the CEA solar team as summarised in Figure 8. For several months, this activity nest produced between 50-70% of all eruptions over the entire surface, including some of the strongest solar flares (X-class events). A better understanding of the formation, evolution, and flaring characteristics of activity nests, facilitated by missions like Solar Orbiter, is crucial for improving space weather forecasts in the short to medium term. By providing a more complete picture of solar magnetic activity, including events on the far side, this research helps to predict and mitigate the potential impacts of solar eruptions on Earth.
Thanks to its unprecedented data on high latitudes and the poles, and its complementarity with satellites close to the Earth, Solar Orbiter is now an essential tool for observing the Sun during this period of solar maximum.
Contacts: A.S. Brun, O. Limousin, A. Strugarek, A. Finley, B. Perri.
References :
- Finley A. J., Brun A. S., Strugarek A., Perri B., 2025, “A prolific solar flare factory. Near-continuous monitoring of an active region nest with Solar Orbiter”, A&A, 697, A217
- Noraz Q., Brun A. S., Strugarek A., 2025, “Global Turbulent Solar Convection: A Numerical Path Investigating Key Force Balances in the Context of the Convective Conundrum”, ApJ, 981, 206
- Perri B., Finley A., Réville V., Parenti S., Brun A. S., Strugarek A., Buchlin É., 2024, “Impact of far-side structures observed by Solar Orbiter on coronal and heliospheric wind simulations”, A&A, 687, A10
- Stiefel M. Z., Kuhar M., Limousin O., Dickson E. C. M., Volpara A., Hurford G. J., Krucker S., 2025, “Using the STIX background detector as a proxy for GOES”, A&A, 694, A138