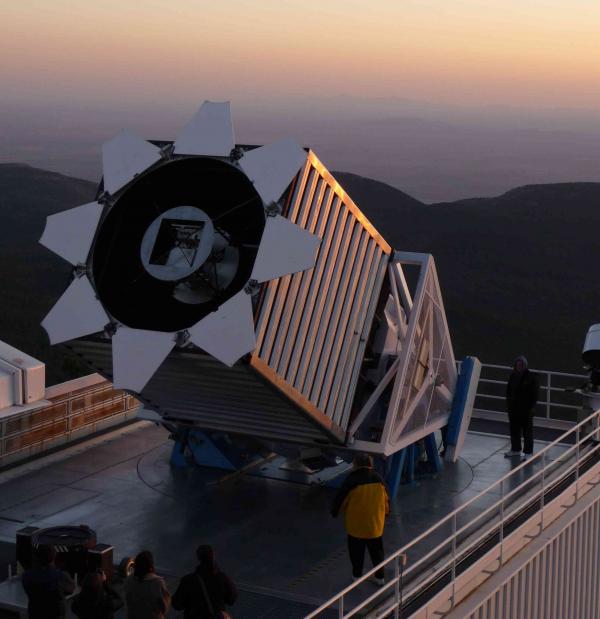
Sloan Digital Sky Survey telescope located at the Apache Point Observatory in New Mexico, USA. It allows among other things to study quasars (credit: SDSS Collaboration).
More than twenty years after the discovery of the acceleration of the expansion of the Universe, the nature of the physical phenomenon at the origin of this acceleration, called "dark energy", is still unknown. The current model of cosmology is based on general relativity as a theory of gravitation and establishes a theoretical prediction for the quantity of galaxies that form at a given period of the Universe. This cosmological parameter is called the growth rate of cosmic structures. It allows to test directly the gravitation theory at the scale of these large structures.
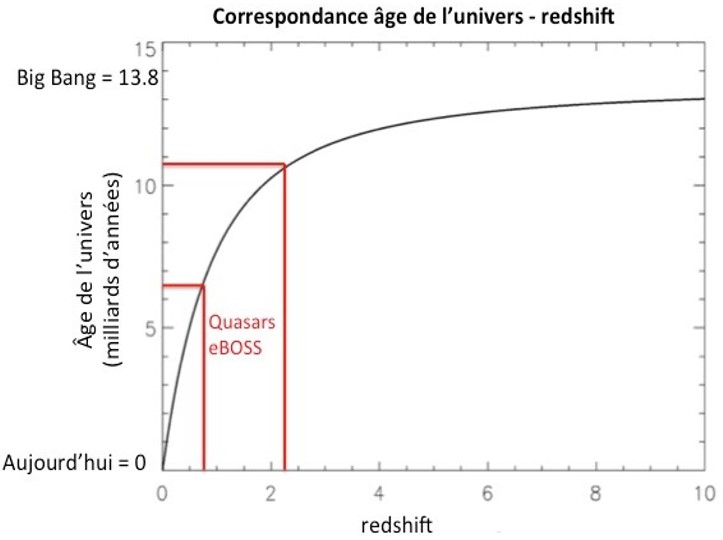
For the first time, the eBOSS multi-spectrograph mounted on the Sloan Digital Sky Survey telescope in New Mexico, allowed to measure this parameter from the distribution of spatial correlations of quasars. Quasars are among the brightest sources of light in the Universe and allow us to probe an era almost unexplored by this cosmological test, when the Universe was between 3 and 7 billion years old. The sample on which the analysis is based corresponds to 2 years of data collection and has already allowed the selection of more than 148,000 quasars. The measurements made confirm the validity of the model of cosmology based on general relativity and can also be used to constrain alternative theories of gravity.
The results were published in the Monthly Notices of the Royal Astronomical Society (P. Zarrouk et al, 2018).
The collaboration continues to acquire data with final analysis planned for the end of 2019, which will double the sample size. DPhP cosmologists are heavily involved in all stages of the eBOSS program, as well as in its successor, the DESI project located at the Kitt Peak National Observatory in Arizona, which is scheduled to begin data collection in 2020.
Using eBOSS Quasars to probe an unexplored era
The 2.5-meter-diameter SDSS telescope located at the Apache Point Observatory in New Mexico (USA) and connected to the eBOSS multi-spectrograph, has been observing an unprecedented number of quasars since 2014. It has allowed astronomers to accurately measure the position of more than 148,000 quasars and to reconstruct the largest map of the spatial distributions of today's large structures more than 10 billion years old (see June 2017 Highlight).
Quasars correspond to active nuclei of galaxies and the intense light they emit comes from the accretion disk located around the central super massive black hole. On the figure opposite, a spectrum of quasars is represented containing several lines corresponding to emission lines from the heated gas during the accretion process. The position of these lines is shifted towards the long wavelengths, we speak of spectral redshift. It gives access to the distance between the quasar and the observer along the line of sight.
 |
The redshift is of cosmological origin and is a consequence of the expansion of the universe. The higher the redshift of an object is, the more the light we capture from that object was emitted long ago. We measure the eBOSS quasars between redshift 0.8 and 2.2 for an average redshift of z=1.52. They thus allow to probe the universe as it was more than 6-10 billion years ago. With this spectroscopic survey, we build a catalog of quasars which contains their position in the sky (2 angular coordinates and the distance between the quasar and us, the redshift). |

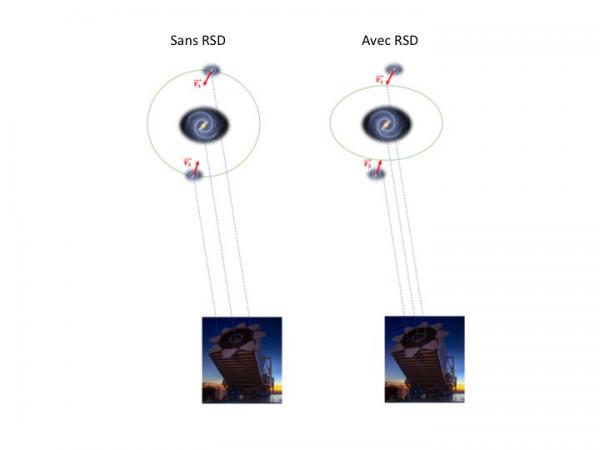
Effect of the "Redshift Space Distortions" (RSD): During the observation, two objects (1 and 2 on the left part of the image) that come closer under the gravitational attraction appear closer, along the line of sight, because the measurement of distances from the redshift is influenced by their own speed (right part of the image).
The technique of "Redshift Space Distortions" (RSD)
From this catalog, we are able to reconstruct the distribution of spatial correlations of large-scale quasars. Assuming that the Universe is homogeneous and isotropic at large scale, we expect to obtain an isotropic distribution, i.e. the same in all directions.
However, the redshift we measure from the spectrum of the quasar, i.e. the distance between the quasar and us, contains the displacement due to the expansion of the universe and the displacement due to the quasar's own velocity.
Taking into account this eigenvelocity introduces deformations at this isotropy (see the case on the right of the figure opposite) which are directly related to the eigenvelocity of the quasar. These eigenvelocities are themselves related to the gravitational collapse whose dynamics are governed by general relativity. Thus, the distribution of the observed quasars presents an anisotropy, the phenomenon of "Redshift Space Distortions" (RSD).
Detection of correlation anisotropies
To do this, we model the distribution of correlations with 2 components :
- a 'monopoly' term which quantifies the isotropic part of the distribution and whose increase comes from taking into account the eigenvelopes of the quasars.
- and a term 'quadrupole' which describes the anisotropies and whose amplitude is sensitive to the growth rate of the structures.
The figure on the left shows the monopoly on the left for the eBOSS data (blue), for the model with RSD (black) and for the model without RSD (dotted black). On the right side of the figure, the quadrupole is shown for the data (blue), the model with RSD (black) and the model without RSD (black dotted).
This is the first time that the technique is applied to a sample of more than 148,000 quasars, thus extending the general relativity tests to greater redshift (z > 1) with respect to the galaxies used until now for this method (up to z~0.8).

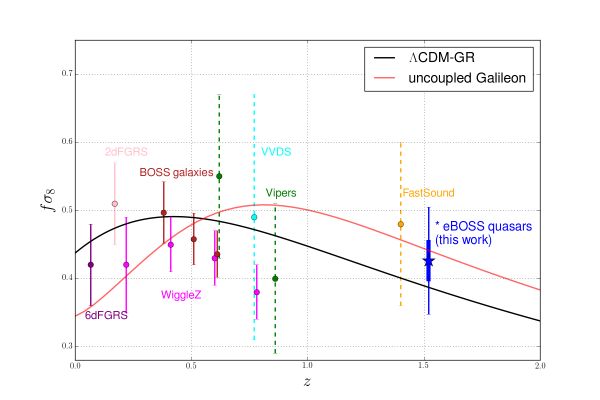
Measures the growth rate of structures as a function of redshift. The results obtained with eBOSS quasars are shown in blue and the expected accuracy at the end of the survey in late 2019 is shown in thick line.
Structural growth measurements made so far have used samples of galaxies, mainly at low redshift (z<1) with an exploratory measurement at z~1.4. When the statistic is low (dashed results in the figure opposite), the structure growth rate is usually measured by setting the cosmology of the model to a certain value. However, these measurements cannot be used to test alternative gravity models.
Indeed, in order to extract constraints independent of the cosmology used to evaluate distances, the cosmology of the model must be left free in the fitting of the data. This allows the simultaneous extraction of cosmological parameters such as the growth rate of structures and the expansion rate of the universe. It is in this context that the measurement from the sample of eBOSS quasars that we have just realized and which is represented in blue on the figure opposite. It confirms the validity of the model of cosmology based on general relativity which is represented by the black curve. These measurements are used to constrain alternative theories of gravity. This is the case of the Galileo theory, whose prediction for the growth rate of structures is represented by a red solid line. This modified gravity theory assumes the existence of an additional scalar field whose couplings with matter could explain the acceleration of the expansion of the universe without using a cosmological constant.
The figure also shows the expected accuracy with the final sample of eBOSS quasars (thicker blue line). Measurements of the growth of high redshift structures, such as the 1st measurement performed with the eBOSS quasars sample, will thus bring new constraints on alternative gravity models for an era of the Universe that will be intensively probed by the surveys of the next decades. These constraints are complementary to those being brought by gravitational waves, which are also very promising.
Contacts: Pauline Zarrouk, Etienne Burtin
• Structure and evolution of the Universe › Dark Universe
• Institute of Research into the Fundamental Laws of the Universe • The Particle Physics Division
• BAO
