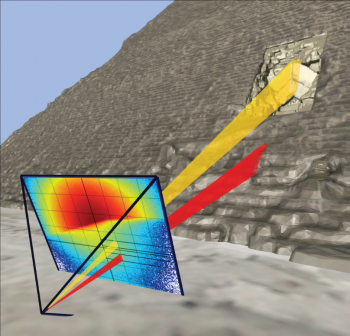
In 2019, a first muon tomography had been carried out from several 2D projections, via a collaboration with the University of Florence. The limitations remained numerous, however, because the imaged object was only about twenty centimeters, with very high density contrasts (Lead bricks), and only one fixed telescope operating in the very particular mode of absorption. One by one, all these limitations were removed through a complete redesign of the algorithms and optimization of the computing times. It is now possible to reconstruct the 3D structure of structures longer than 100 meters, with realistic density variations and any number of telescopes operating in the most general mode of transmission. As an illustration, the number of matrix elements of the system to be solved has thus increased from about 10 million for the 2019 version to more than 20 trillion today.
Introduction
Muon imaging, which uses natural cosmic rays, is a non-invasive method for probing the interior of large structures in particular. In the most common cases, these measurements provide a 2D image of the average density of an object, by estimating the flux of muons having passed through it (so-called transmission measurements). The observation of differences in density on an image does not allow the 3D positioning of a sub-structure, which at least must be obtained by triangulation from several observation points. Triangulation can be long and tedious, especially if several sub-structures have to be identified. The ideal is then to be able to combine 2D images to obtain a tomography of the object. In the most general case of muon imaging, many difficulties arise :
- Low number of projections due to the acquisition time required for large objects (several weeks to several months)
- Non-uniqueness of the solution (like most inverse problems) and number of measurements far less than the number of unknowns in the system
- Lack of open-air flow measurement, and the need to rely on simulation tools (which must therefore reproduce real data with great accuracy)
- Huge size of the system matrix to be solved, involving very high CPU resources and computation times
A first step was taken last year with the tomography of a small lead object [1]. The strategy was to iteratively solve the following system:
Where is the vector of densities in each voxel of the volume to be imaged (thus the vector of unknowns),
is the vector of the measured opacities in each direction of observation, and
is the distance matrix, which can be computed once the voxels and the directions of observation have been defined (as an illustration, this matrix contained about 6 million elements for the small object imaged in 2019). The reconstruction algorithm is based on the SART (Simultaneous Algebraic Reconstruction Technique [2]) whose each iteration consists in updating the density of the v voxel by estimating a density deviation using the equation :
Where is the number of measurements and :
3D reconstruction of large object
The above algorithm can first be generalized to several telescopes or shots, by computing the matrix and the vector
of each position, then concatenating them vertically, at the price of a significant increase in the size of the system. On the other hand, and contrary to absorption measurements, transmission does not directly provide
, but a transmitted muon flux. This flux must therefore first be normalized to a transmission factor via open-air simulations (i.e. without the object) of each position, which thus use a parameterization of the differential muon flux. Then this transmission factor is itself converted into an opacity by means of an ad hoc calibration obtained with Geant4.
An essential aspect of this problem is the computing time associated with its resolution. The reconstruction of the small object imaged last year took only a few minutes on a single PC, and therefore did not require any particular optimization. When the first version of the code generalized to large structures was functional, it was realized that the reconstruction time of an object the size of a pyramid with a resolution of 50 cm would take on the same PC... 47 years! Not counting the memory management problems. Several optimizations were therefore necessary on the calculation and access to this matrix, but also on the speed of convergence of the algorithm, with the result that the calculation time was reduced by a factor of 15,000.
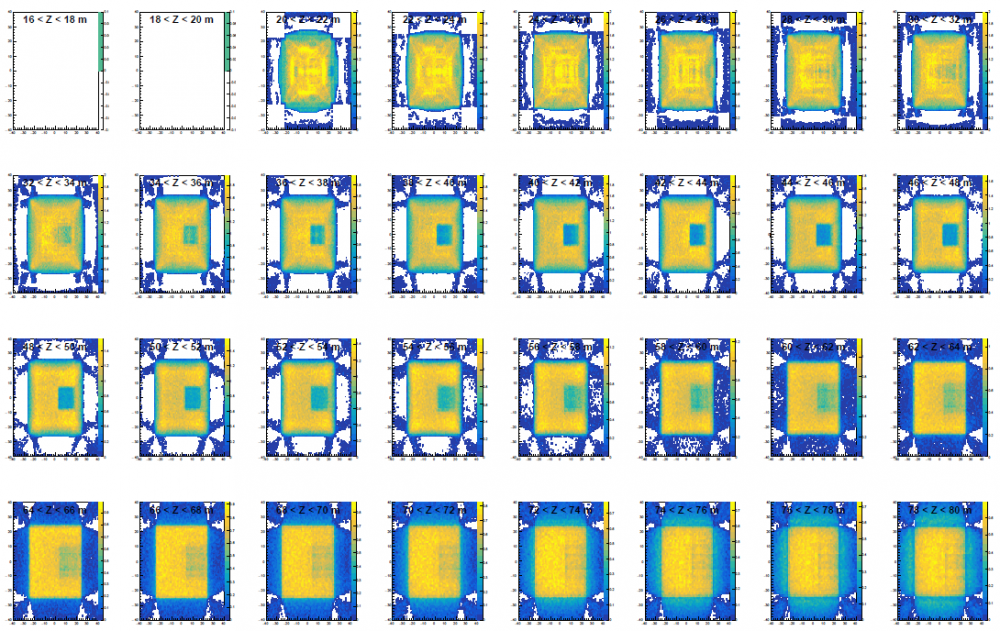
For illustration and validation of the method, a first reconstruction was performed with simulated data of a cube of 50 m side, density d=2, and containing itself a cubic cavity of 15 m side. Nine telescope positions under the cube were simulated, each corresponding to one month of acquisition. A volume of 80 m of side including this object was cut into voxels of 0.5x0.5x2m3. The muography of each position was cut into 10,000 independent measurements, resulting in a matrix of approximately 90 billion elements. The figure below shows the slice tomography of the reconstructed object after 150,000 iterations, corresponding to 10 hours of computation. The transverse limits of the large and small cube can be perfectly distinguished, with a resolution of less than one meter. Given the absence of side shots, their vertical limits are necessarily less clear.
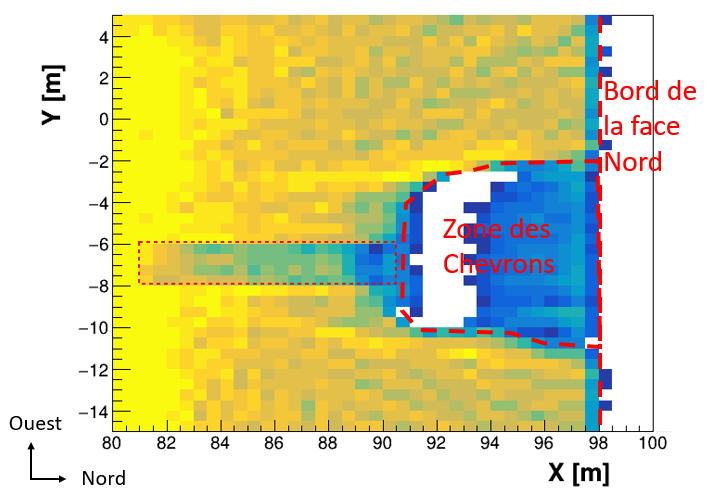
In order to validate this code under extreme conditions, a second test was carried out by simulating all the data taken by the CEA telescopes inside the Cheops pyramid (11 positions). The pyramid defined in the simulation includes all the currently known voids, as well as a hypothesis of the North Face Corridor detected in 2016 by the University of Nagoya. The volume to be imaged is in this case a gigantic parallelepiped of 230m side and 140m height, and each muography was cut into 40,000 independent measurements. The number of matrix elements of the system to be solved then reaches 26,000 billion (a pharaonic number!). Following the optimization of the convergence of the algorithm, the 3D reconstruction takes about two days on a computer center machine. Note that in this case, the density vector is initialized by assuming a full and perfect pyramid, which corresponds to information visible from the outside. The figure below shows a zoom of the reconstructed image at the level of the rafters where the NFC was simulated. Despite the fact that this system contains 130 times more unknowns than equations, the algorithm succeeds in reconstructing the shape of the empty area in front of the rafters (where many stones have been removed over the centuries), as well as the simulated NFC.

Figure 2: Density distribution obtained in the vicinity of the Chevron zone (between Z=18.5 and Z=22.5m). In addition to the Chevron zone and its asymmetrical East-West shape, the tomography algorithm correctly identified and reconstructed a sub-density corresponding to the simulated corridor, whose position is represented by the thin red rectangle.
The use of this algorithm on the real data of the pyramid has also made it possible to reconstruct this area satisfactorily, and the data will be published soon. Incidentally, this reconstruction method no longer needs a geometric model of the object upstream to compare data and simulation, since this geometry is produced directly by the algorithm. Other large structures are currently being probed by the Irfu muon telescopes, in particular a nuclear reactor, and will thus eventually be able to be imaged in 3D.
References :
[1] : http://irfu.cea.fr/Phocea/Vie_des_labos/Ast/ast.php?t=fait_marquant&id_ast=4621
[2] : A. C. Kak, M. Slaney and G. Wang, "Principles of computerized tomographic imaging." Medical Physics 29.1 (2002): 107-107. Chapter 7
Contact : S. Procureur (Irfu/DPhP)


