


To retrace the history of the Universe, physicists need to make images of it at its different ages, going back tens of billions of years.
Scientists from the Sloan Digital Sky Survey (SDSS-III), including a group from Irfu and CNRS (IN2P3 and INSU), have produced the largest map of the distant Universe from the BOSS (Baryon Oscillations Spectroscopic Survey) survey. This three-dimensional map shows the position in space and time of intergalactic hydrogen gas clouds. It was obtained using light from the brightest objects in the cosmos, quasars, which illuminate these clouds that can then be imaged. More than 14,000 quasars were used to make this first hydrogen map of the Universe, whose 3rd dimension allows us to go back in time. At the end of 2014, a new map will be established using a number of quasars ten times higher. It will then offer a new view of the Universe as it existed 11 billion years ago and will make it possible to study how the expansion of the Universe has evolved throughout its history.
The quasar, a lighthouse in the background on gas clouds
Quasars are very luminous objects whose energy comes from giant black holes. They are visible billions of light-years away. When the light from a quasar makes its long journey to Earth, it passes through clouds of intergalactic hydrogen gas. The Ly-a line is characteristic of the spectrum of this neutral hydrogen. The clouds absorb this light at specific wavelengths, depending on their distance. This absorption imprints an irregular pattern in the light of the quasar known as the "Lyman-a forest". Each line that appears in the spectrum (because it is an absorption) corresponds to a hydrogen cloud.

High-resolution spectrum of a quasar; the Lyman-a forest can be distinguished between the Lyman-a and Lyman-b peaks specific to the observed quasar
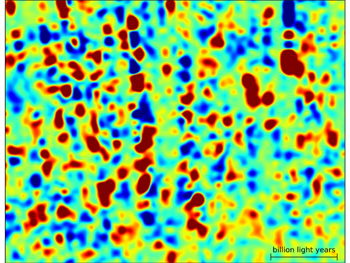
Zoom on the map of the Universe in 3 dimensions, with zones rich (in red) or poor (in blue) in hydrogen
Quasar hunters
French teams1 composed of a group of physicists from the particle physics department of Irfu, and teams from CNRS laboratories (IN2P3 and INSU) played a major role in obtaining these results. On the one hand, they are responsible for the identification and selection of the quasars that are then observed by the Sloan telescope and the BOSS spectrograph. Also in charge of the identification and validation of these quasars from their "spectrum", the French group provided the quasar catalog that was used in this study and contributed to the data analysis.
This is thus the first time that the Lyman-a forest has been used to measure the three-dimensional structure of the Universe, which can be seen in the figure below.
Towards a map to study the expansion of the Universe
By the time BOSS observations are completed in 2014, 150,000 quasars will have produced a new map of the universe, ten times larger than the one published today.
The goal of BOSS is to use measurements of density fluctuations in these maps to study how the expansion of the Universe has changed over its history, and to provide information about the nature of dark energy.
1 Laboratoire Astroparticule et cosmologie (CNRS / université Paris 7 / CEA / Observatoire de Paris), Institut d’astrophysique de Paris (CNRS / université Paris 6), Service de physique des particules du CEA (Institut de recherches sur les lois fondamentales de l’Univers, CEA/Irfu), Laboratoire d’astrophysique de Marseille (CNRS / université de Provence / Observatoire astronomique de Marseille-Provence).
To know more about it
Online article: http://arxiv.org/abs/1104.5244
Website SDSS-III : http://www.sdss3.org
Contacts :
Irfu/SPP : Christophe YECHE
IN2P3/APC : Éric Aubourg
INSU/IAP: Patrick Petitjean
• Structure and evolution of the Universe › Evolution of the large structures and galaxies
• The Particle Physics Division
• BAO
